 |
|
|
|
|
| Presentation of data |
|
| What is pollen analysis? |
| Examples of Quaternary pollen types |
|||||
|
|
||||
|
|
||||
|
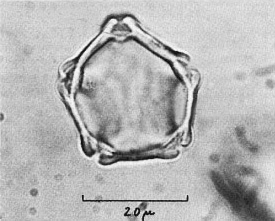
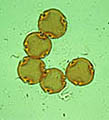
5 - Pollen of ribwort plantain (Plantago lanceolata), an example of periporate pollen, diameter of each pollen grain c. 25 µ. |
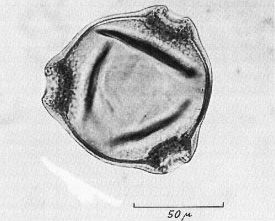
6 - Pollen of European lime (Tilia cordata), an example of tricolporate/ suprareticulate-foveolate pollen, diameter of each pollen grain c. 32 µ. |
|
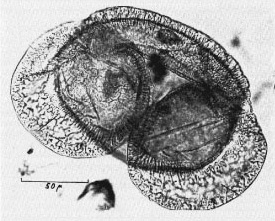
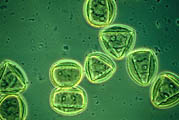
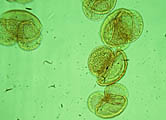
7 - Pollen of mountain pine (Pinus mugo), an example of vesiculate pollen, longest diameter of each pollen grain c. 70 µ. |
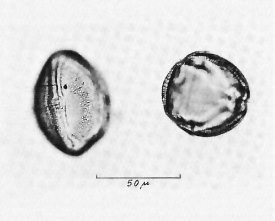
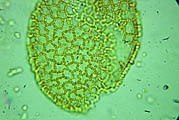
8 - Pollen of Martagon lily (Lilium martagon), an example of monocolpate/ reticulate-homobrochate pollen type, longest diameter c. 40 µ. |
|
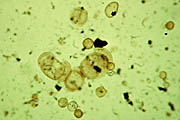
9 - A sample under the microscope showing fossil pollen and spores of mountain pine, Swiss stone pine, grass, green alder and fern spores. |
|
Nature offers a great diversity of pollen and spores types Pollen grains are microspores of flowering plants containing the male gametophyte; spores are plant reproductive cells capable of developing into a new individual, directly or after fusion with another spore. The classification of pollen grains into 22 pollen classes is based on their shape, aperture type (point of emergence of the pollen tube), surface pattern (structure and sculpture) and size. Fossil pollen grains consists of an acid-resistant outer layer (ektexine) with a typical structure and sculpture. Fig. Xy shows some examples.The pollen size of Central European flowering plants vary between ca. 3 micro m (stinging nettle) and ca. 300 micro m (silver fir), its weight lies between 3,3 ng (stinging nettle) and 480 ng (maize). The pollen production is very variable, it depends on the pollination biology:
The first group is in the pollen sedimentation mostly statistically
overrepresented, the second group underrepresented. |
|
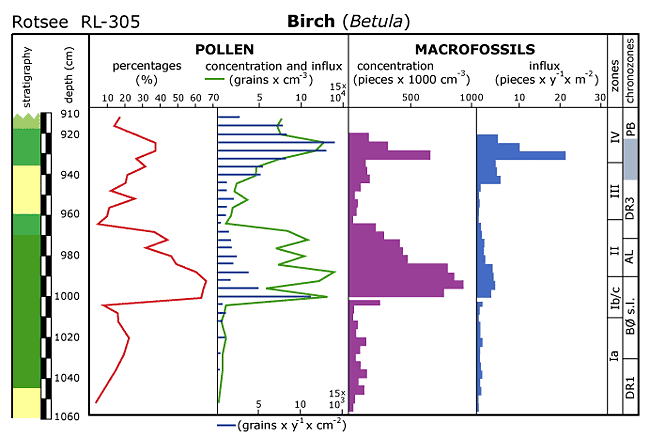
The data can be presented as lists, frequency diagrams or curves as in the familiar pollen diagram shown in Figure 10 below.
10 - Pollen diagram with helpful information about the investigated stratigraphy: depth of the different layers with concentration and influx of pollen and macrofossils. |
29 August 2011 |
||
| |
||
 Pollen
analysis is a technique used by palaeoecologists to assist in the reconstruction
of palaeoenvironments. It is based on the identification and counting
of the various pollen and spores types which have been preserved in inorganic
and organic sediments (mainly peat). Pollen and spores help to reconstruct the former
vegetation and with it other environmental parameters such as climate or soil conditions.