Data Challenge ICC 2013 Pre-Conference Workshop — Eye tracking: why, when, and how?
The provided data is to be used for the data challenge, as announced by the ICA Commissions Cognitive Visualization, GeoVisualization, and Use and User Issues for their pre-conference workshop at ICC2013 in Dresden. We release the data under the Creative Commons License. For any questions you may have, please be in touch with Arzu Coltekin. Please cite papers below and inform us about your analysis and or visualizations solutions, should you use the data set provided below in your publications.
Study design and related publications
This study comparatively analyzes two different map (and interface) designs containing identical information. Thirty participants took part in the between-subject study, that is, fifteen participants worked with each design. The study design is explained in the following papers, including tasks, stimuli, and participants.
- Coltekin, A., Heil, B., Garlandini, S., Fabrikant, S. I. (2009). Evaluating the Effectiveness of Interactive Map Interface Designs: A Case Study Integrating Usability Metrics with Eye-Movement Analysis. Cartography and Geographic Information Science, 36(1): 5-17.
- Coltekin, A., Fabrikant, S. I., Lacayo, M. (2010). Exploring the efficiency of users' visual analytics strategies based on sequence analysis of eye movement recordings. International Journal of Geographical Information Science, 24(10):1559-1575.
The two papers also include the analysis we have already conducted with this data set. The first paper describes the study and offers eye tracking metrics as well as statistical analyses based on usability metrics. The second paper analyzes group differences based on performance (high performers vs. low performers), and studies participants' temporal viewing strategies (i.e., fixation sequences between areas of interest).
Data
Download the .zip file with 30 tab separated files (.tsv) here. You will find files labeled in this fashion:
p01ng.tsv
p02nn.tsv
..
..
The first three characters (p01, p02) of the file label are participant numbers. The fourth character will be n or c, indicating the stimulus type. n is for Natlas, c is for Carto.net, the two dynamic map interfaces used in the study. The fifth character is either g or n, indicating participant expertise. g stands for "geographer", and n stands for "non-geographer".
The data files contain raw eye movement recordings. There are 41 variables (i.e., columns) in the file. Relevant fields to the data challenge are the following:
- Timestamp: raw temporal sampling times in milliseconds.
- PupilLeft: Pupil size for the left eye.
- PupilRight: Pupil size for the right eye.
- MappedFixationPointX and MappedFixationPointY: the X,Y coordinates calculated based on the average of the binocular recording, mapped to the screen coordinate system (1600x1200 pixels).
- Fixation duration: the duration of the fixation at the point of gaze, based on a min. 100ms temporal, and min. 50 pixel spatial filter threshold.
Stimuli
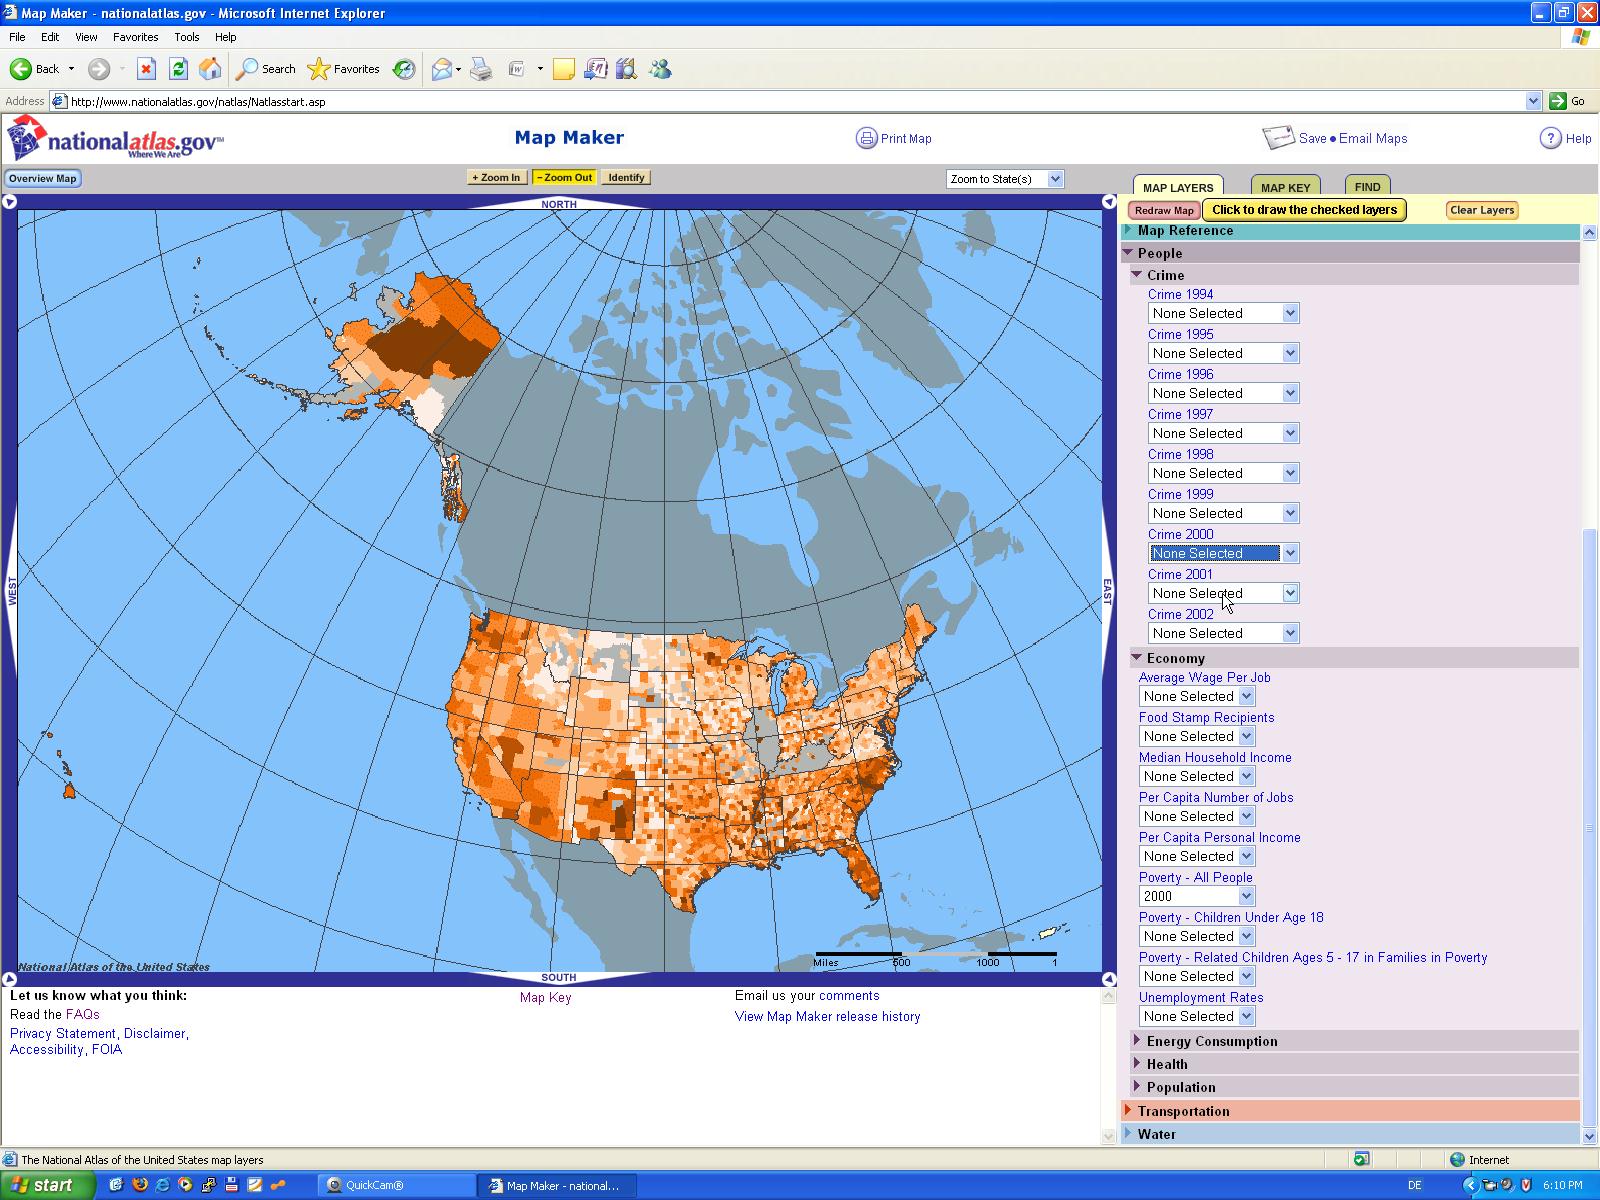
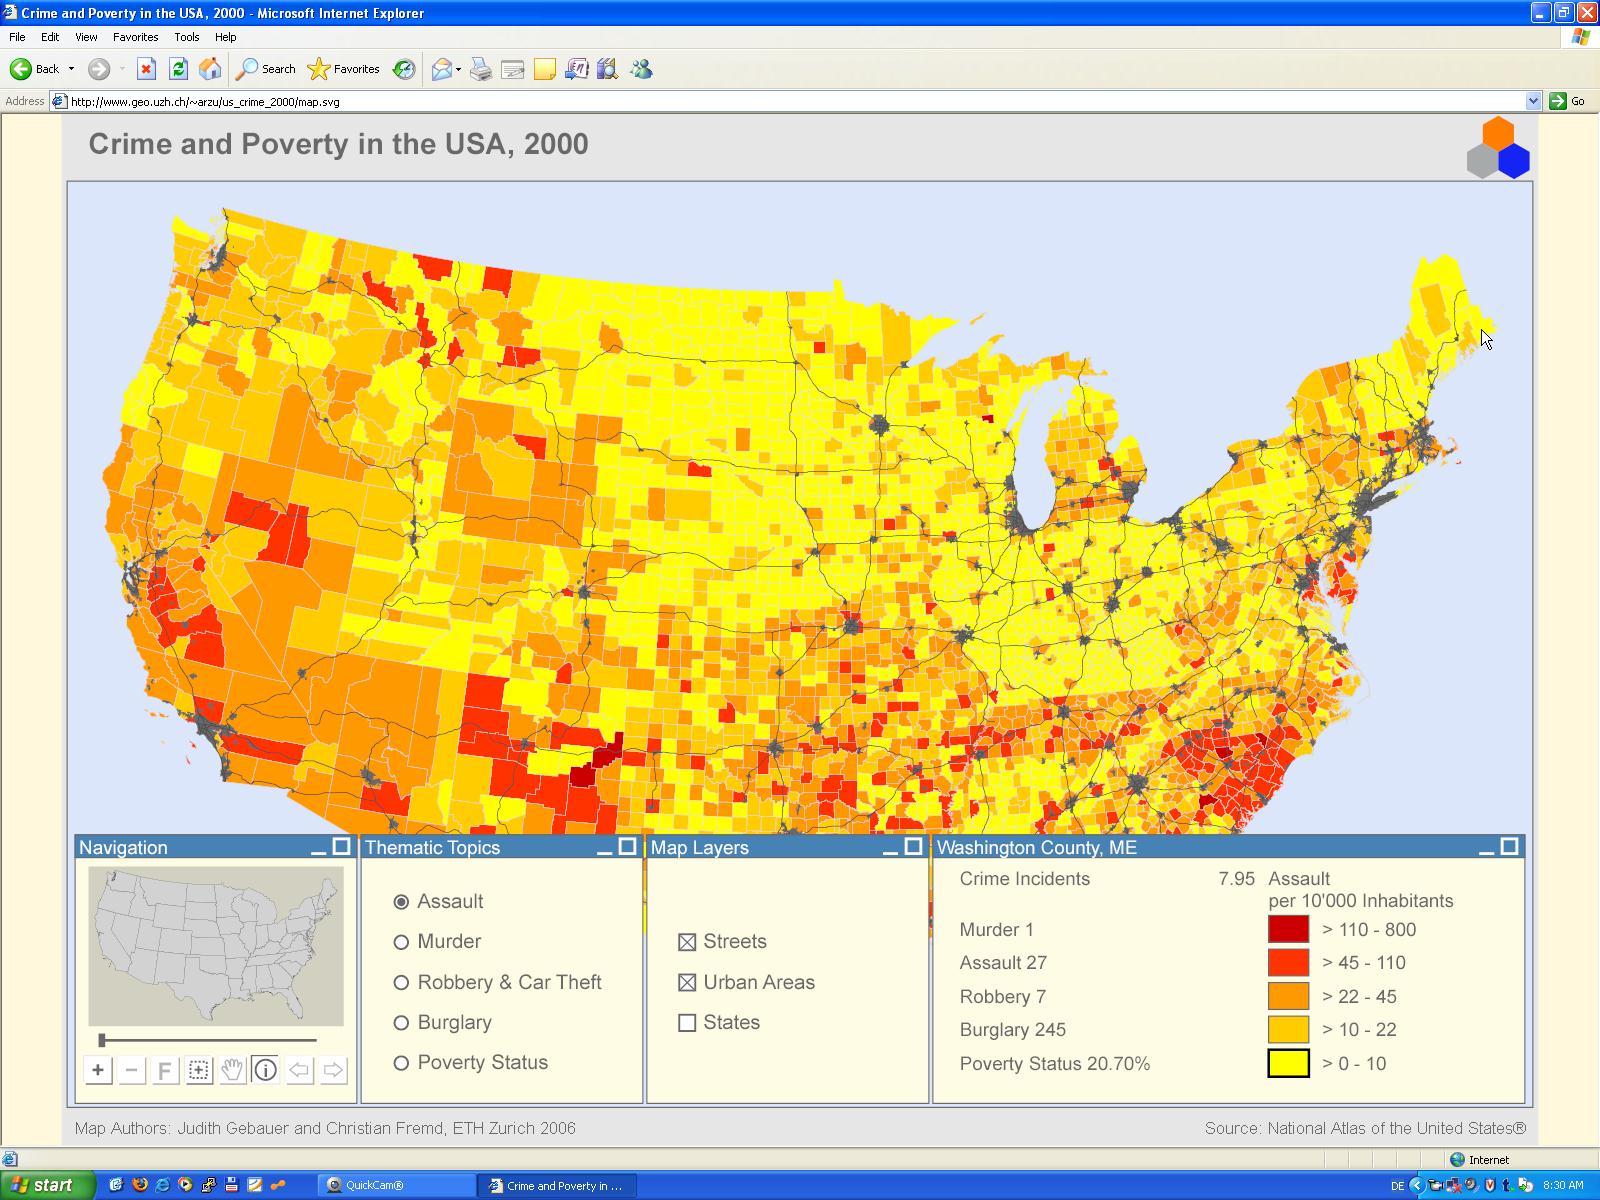
The stimuli, referred to as Natlas and Cartonet in the papers are dynamic, i.e., participants can interact with them. Below are two screenshots that you can use as background images when working with the gaze data. Other scenes, and/or video footage are available upon request.


Pictures: the studied Natlas (left) and Carto.net (right) interfaces. Click on the pictures for a higher resolution image.
Study tasks
Participants responded to the following questions during the study:
- What is the number of assaults in Washington County (Maine) in the year 2000?
- Which county in the State of Oregon has the highest murder rate in the year 2000?
- Looking at the map of the U.S.A., overall, do you see a relationship (if any) between poverty rates and burglaries
in the year 2000?
Data challenge tasks
- Can the eye movement data explain potential differences in task difficulty levels between task 1 and task 2?
- If yes, is this dependent on the stimulus, user background and training, or participants' pupil size?
- What eye movement patterns can help explain this potential difference?
- Are there differences in participants' gaze patterns for task 3?
- How can one best visualize various eye movement metrics to detect possible correlations?
[ see also two more data sets available here (Geovis) and here (UUI) ]


