
Results
Annual development of overnight stays over the last 10 years
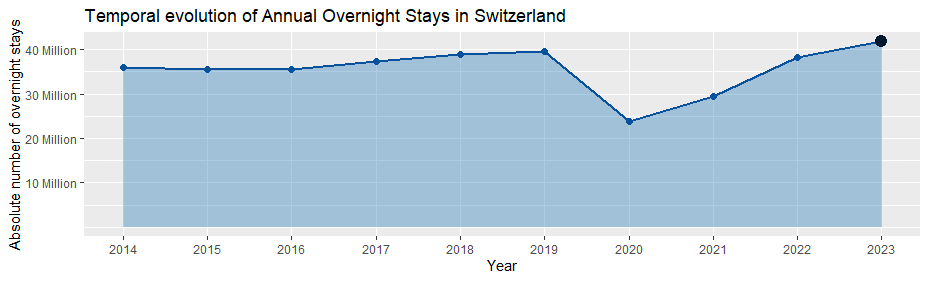
During the last 10 years the total number of overnight stays per year in Switzerland increased by approximately 7 million people (Fig.1). Nevertheless, this increase is not continuous, as Figure 1 demonstrates a decline in the total number of overnight stays in 2020. In this period between 2019 and 2020, the number of overnight stays decreased by 16 million, representing a decline of 8% in the number of tourists visiting the country. However, the number of overnight stays subsequently rose significantly in the following years, with the number of overnight stays in 2022 once again equaling that of 2019. The decline can be attributed to the implementation of measures to contain the spread of the novel coronavirus (Covid-19). Following the lifting of the measures, overnight stays reached an all-time high.
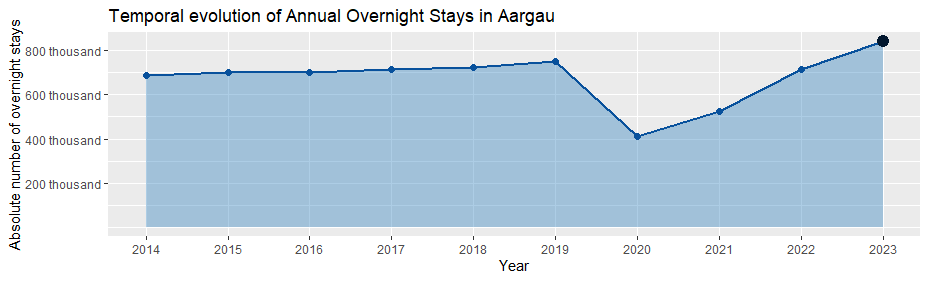
By looking at the graph at a cantonal level (Fig. 2) one can see that the picture is very similar to the national level (Fig.1). In most of the cantons the "Covid-decrease" is visible. Overall, there is a similar recovery from the measures and at the end of 2023 the numbers are at an all-time high as well.
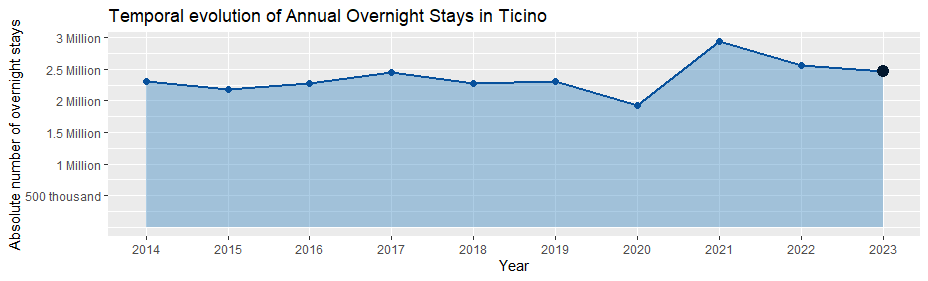
Outstanding are the progression of the cantons "Ticino" (Fig.3) and "Grison" (Fig.4). In Ticino the "Covid-decrease" is way smaller compared to the rest of Switzerland and the other cantons. Furthermore, the recovery was more rapid, reaching its highest point in 2021. Over the past two years, there has been a downward trend in the number of overnight stays.
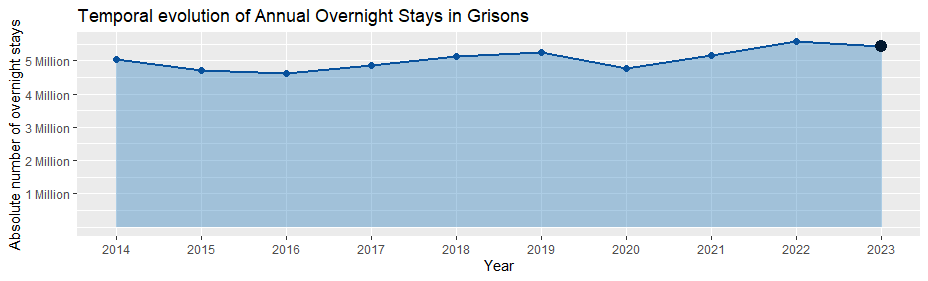
"Canton Grison" has the only more or less stable graph. The graph looks resilient to the Covid-19 measures. Despite a decline of approximately half a million overnight stays between 2019 and 2020, the canton demonstrated a swift recovery, comparable to the evolution of overnight stays in Ticino.
Monthly development of overnight stays over the last 10 years
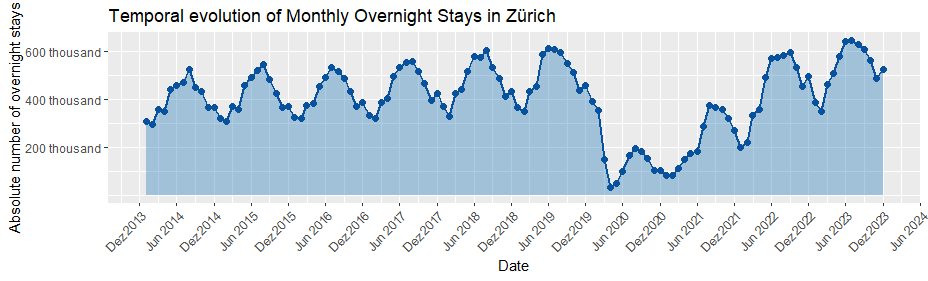
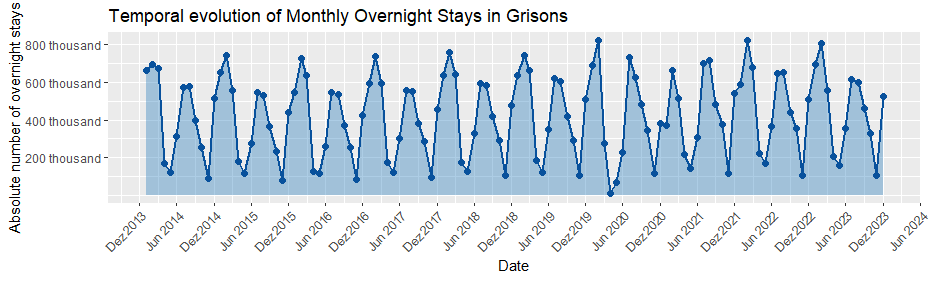
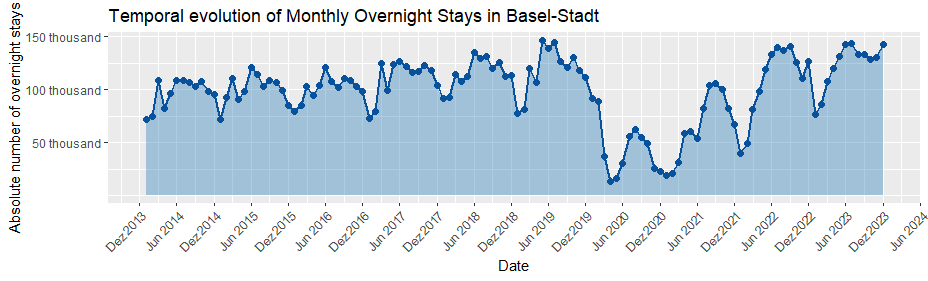
The development of the monthly number of overnight stays shows a more differentiated picture. Some of the cantons have only one peak value per year, such as "Zurich" (Fig. 5) or "Fribourg". In other cantons there seem to be at least to peaks, one in winter and one in summer, as e.g. "Grisons" (Fig. 6). And a final group seems to have a lot of small peaks but all in all the numbers do not fluctuate as much as e.g. in "Basel-Stadt" (Fig. 7).
Where did the tourists who stayed overnight in Switzerland between 2014 and 2023 come from?
At the national level, the greatest number of tourists in Switzerland come from Switzerland itself. This indicates that most individuals who stay for at least one night are from Switzerland. This is true for the total number and the normalized number of overnight stays.
Furthermore, it can be observed that neighboring or nearby countries of Switzerland also have a high total number of overnight stays. Countries that apply for that criteria are for example Germany, France and England. Further, countries with a large population tend to have a high number of overnight stays, as evidenced by the United States. A high number for overnight stays per 100,000 inhabitants applies especially for neighboring, close and small countries such as Austria and Belgium.
The overall picture at the cantonal level is comparable to that observed at the national level. On both, cantonal and national level, Switzerland is the country where the most people originate from. It is interesting to note that for the cantons bordering other countries, the number of tourists from countries other than Switzerland differ. For instance, the canton of Vaud has the second-highest number of overnight stays from French tourists. The canton of Zurich has the second-highest number of overnight stays from Germany, while the canton of Ticino has a notable number of overnight stays from Italy.
Furthermore, there is a seasonality visible, which is similar to the graph described above. However, the proportional relationships between the countries remain the same for each canton, regardless of the month or year.
Discussion
The interactive map and the corresponding graphs provide a comprehensive overview and answer to our research question "Where did the tourists who stayed overnight in Switzerland between 2014 and 2023 come from?". The answer is not that simple and straight forward, this is why it is best explored with our visualization. Therefore, we recommend to explore our map by yourself. Nevertheless, we provide a brief summary in the text below.
Most tourists who stayed overnight in Switzerland between 2014 and 2023 came from Switzerland itself, followed by Austria, Germany, Belgium and the Netherlands. This applies for the numbers of overnight stays per 100,000 inhabitants. This means that tourists from these countries spend the most nights in Switzerland even if all countries had the same population. By looking at the total number of overnight stays in Switzerland other countries are standing out as well. For example Great Britain, Italy and USA are all countries of origin with a significant numbers of overnight stays. To conclude it is evident, that there are many countries where people came from, who stayed overnight in Switzerland. It is evident that countries with more overnight stays often share common attributes, such as a close geography to Switzerland, the same official language or a high GDP.
In conclusion, it can be summarized that the vast majority of overnight stays come from people from Europe. Another significant but much smaller proportion comes from North America. The barplot also visualizes this and is covered by the above analysis.
Limitations and Problems
Due to the great difference between numbers of the different countries and the goal to generate an interactive choropleth map, we had to normalize our data to display it properly and correct on our geographic visualization. Otherwise, the data would not be comparable. Furthermore, we used a logarithmic scale for the classification, since the exceptional high numbers for overnight stays from Switzerland otherwise would have made the map unreadable. However, to answer our research question, the quantitative numbers are more important, as the impact on infrastructure, environment and economy comes from the total numbers of tourists and their overnight stays. Nevertheless, the normalized data could be interesting to find out where the biggest interest in Switzerland as a touristic destination is, which could be used by advertising companies or travel agencies to attract tourists. Therefore, our pop-up shows both data.
The mentioned difference between the amount of overnight stays of the countries was difficult to solve and to come up with a proper solution. Further it took us a good amount of time to prepare our data set. As we have data since 2005 all in one excel file it took a lot of storage space and ram, which made every work step slow. Other difficulties came up with different scaling inside the file and therefore on the map, as we work on a national and a global level. All in all we could say that the gathering and manipulation of data took the largest part of our work.
Another limitation of this project is, that the HESTA statistic of the overnight stays does only include hotels. Since this is not the only form of tourist accomodation, the numbers do not display the total overnight stays of tourists in Switzerland.
A technical difficulty that we encountered, and which was menitionned as feedback on the presentation of the map is that for the color ranges for the different categories on the map, the end value of the previous categors is displayed as start value for the next category. This makes it seem as if values are classified twice. While in reality they are only classified once. We tried solving this issue, but could not find a solution.
Another technical limitation that our RShiny App currently has, is that for the input selection of the year and month, the list from which the input can be chosen is longer than the box that surrounds the input selction. This makes for some impractical scrolling issues. We would have liked to have the list of input to be ontop of the box and extend out of it, but could not make it work.
Improvements
While analysing our results we came up with some improvements to implement in further steps. To have a better overview and to compare the countries of origin it would be good to have a list next to the map which displays for the current selection the different countries and its numbers. In that list you should be able to filter for the lowest and highest amount both in quantitative and normalized data.