

Background
About the Sustainable Deveolpment Goals
The United Nations' 17 Sustainable Deveolpment Goals (SDG's) were set in 2015 as part of the 2030 Agenda for Sustainable Development (see image below). They aim to mitigate the effects of climate change while also creating guidelines for a more sustainable and just feature. For the Chronotram project we chose to focus on the 11th SDG: sustainable cities and communities, more particularly the target 11.2: affordable and sustainable transport systems. Thus, Public transport is central to sustainable cities. It also is a part of UN SDG's no. 9 (Industry, Innovation & Infrastructure) and no. 12 (Resonsible Comsumption and Production) to a lesser degree. This is our chosen target's statement ensuring access to public transport:
"By 2030, provide access to safe, affordable, accessible and sustainable transport systems for all, improving road safety, notably by expanding public transport, with special attention to the needs of those in vulnerable situations, women, children, persons with disabilities and older persons."-United Nations, SDG11, Target 11.2


 Sources: SDG11,
SDG9,
SDG12
For more information about these three SDG's click the image icons above to get directly to the UN SDG website or the links below them for the wikipedia articles respectively.
Project topic
In this project we want to motivate more people to use the already existing public transport. Our project's focus lies on the city of Zurich and its tram network. We aim to explore and show the presumably high quality of the public transport network of the city of Zurich. To this end we decided to create Chronotram, a map showing you how quickly and how far you can move around Zurich by tram in a given time. Chronotram uses a subset of 49 tram stops from all over Zurich and models how far you can get in different given time intervals, spanning 5 to 30 minutes in 5 minute increments.About Zurich's tram network
The city of Zurich's transport services, the Verkehrsbetriebe Zürich (VBZ), run the tram network which currently consists of 15 lines. The VBZ facts lists 860'000 total daily passengers (including buses) on 170km of tracks and in some 258 trams. The city is thus already well connected, especially when considering it has just a little more than half that number of inhabitants at about 450'000, according to the newest available population data. Still, there are plans in the making to expand the network even further by the year 2040 (see Netzentwicklungsstrategie 2040) and beyond. This is due to the fact that today most tram lines today are cross-city routes (ger.: "Durchmesserlinie") and thus more tangent lines or ring lines are needed (ger.: "Tangentiallinie / Ringlinie") to further increase connectivity between different parts of the city themselves without accessing the central hub area.
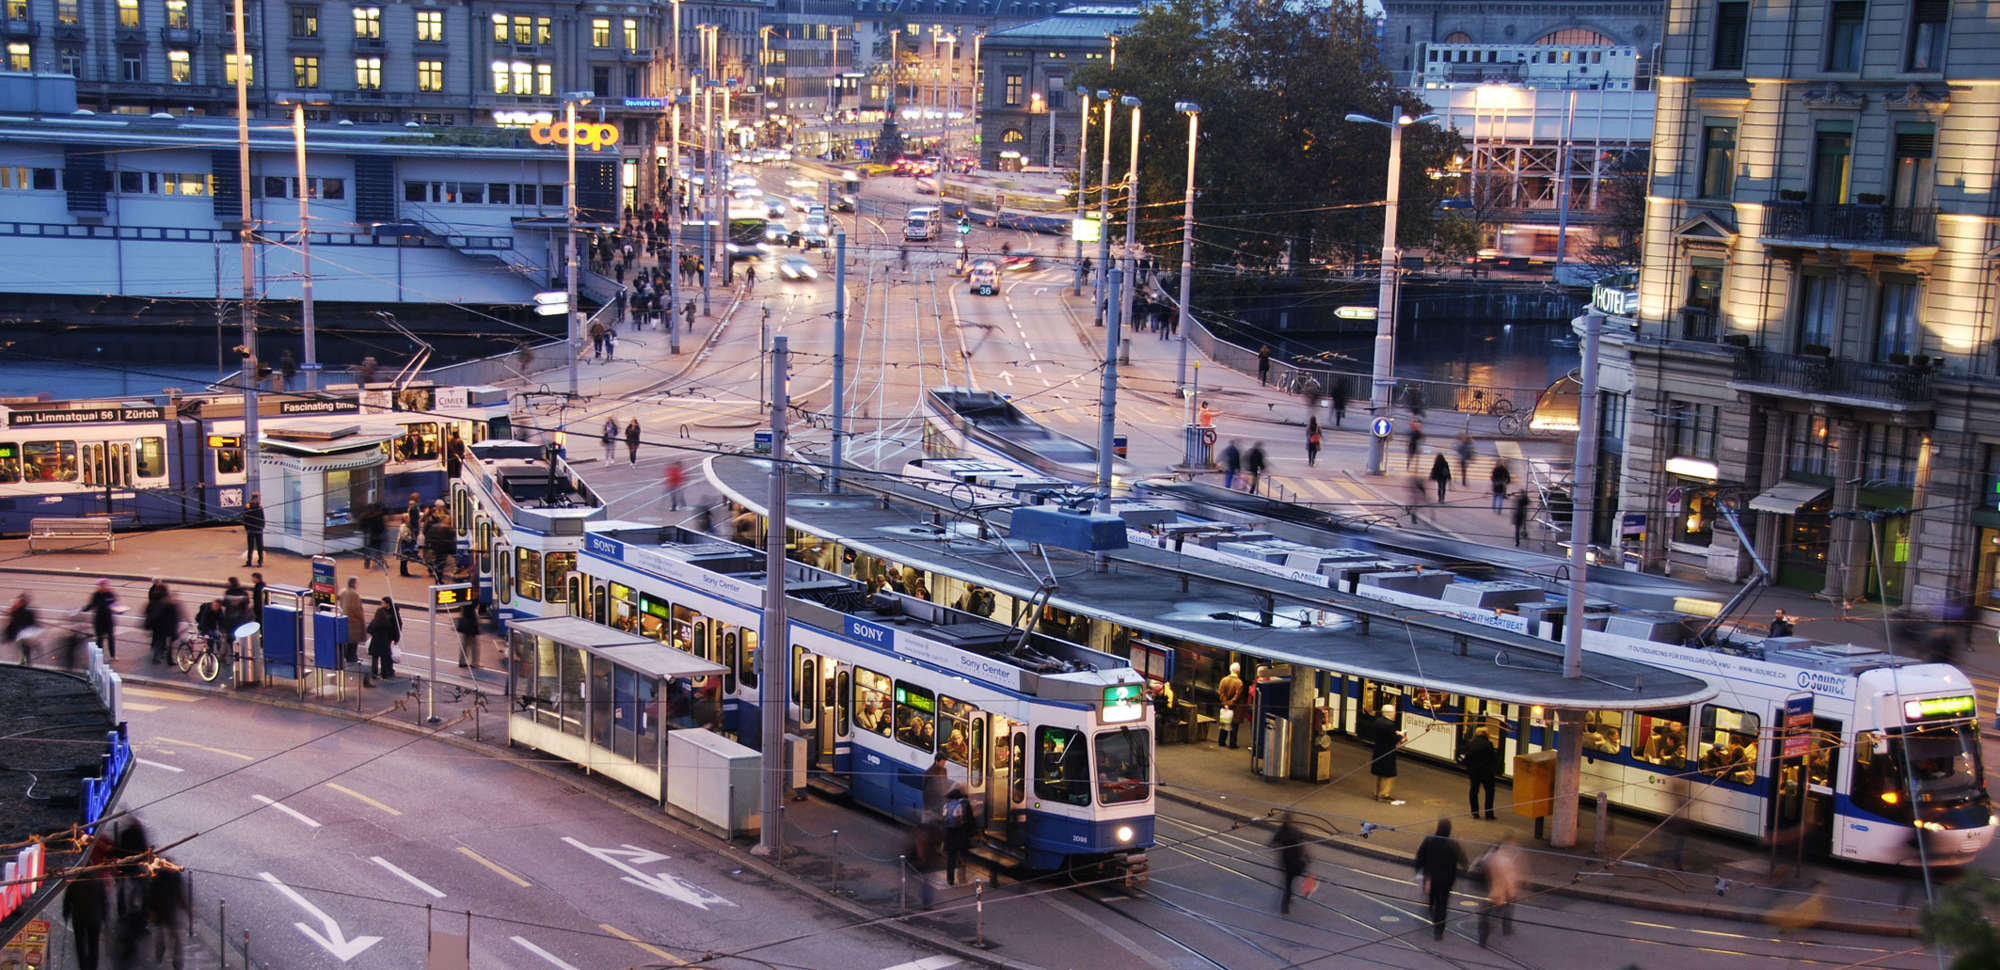 Source: Zurich by Tram
Motivation
As already stated, we want to show how accessible the city of Zurich is by only using trams. Our hope is that through this project more people get motivated to use the public transport thereby making the city of Zurich more sustainable. This would also contribute to the mitigation of a multitude of problems, the city is currently facing. Probably the most important of them are daily commuter traffic jams at rush hour created by motorized individual transport, a much less efficient method than public transport. Furthermore, increased shares of public transport utilization could positively impact air quality and thus life quality in the city by directly reducing emissions otherwise caused by motorized individual transport, thus contributing to enhanced public health. In a more financial perspective, increased use of public transport would also increase its revenue thereby enabling the VBZ to invest more funds to ensure and further increase service quality.
During the conceptualisation phase of the project, we expected our end result to look something like the following sketch.
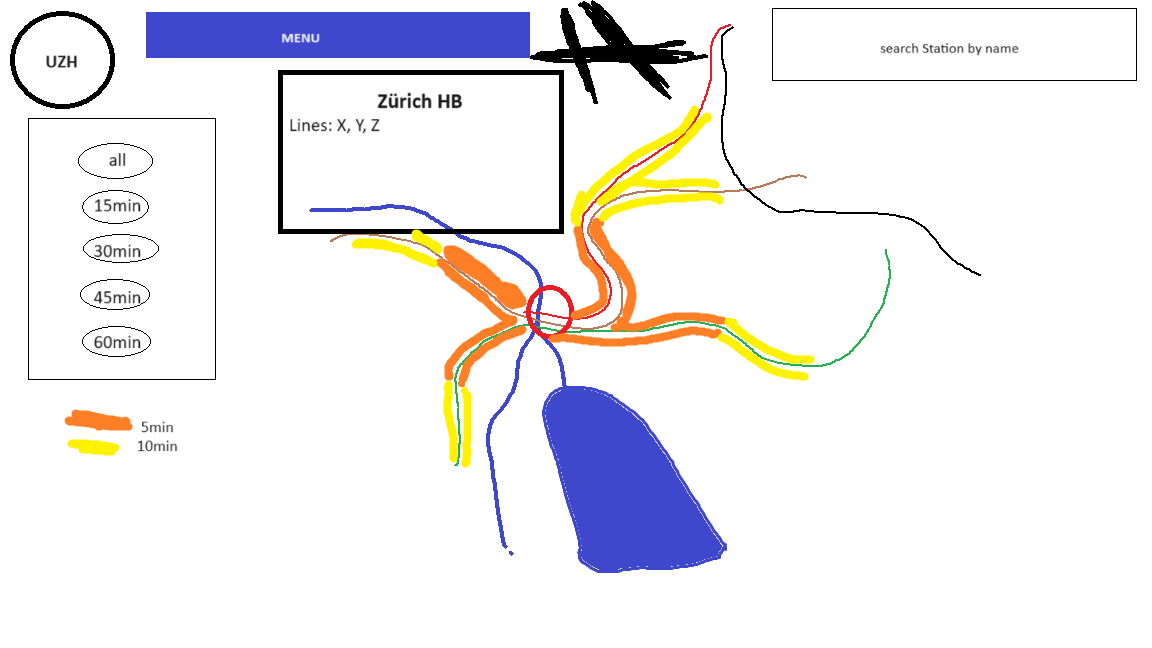
We thought the site should handle as follows:
- by default the user sees a map of the city of Zurich and its tram network
- the user has the option to choose a station by clicking on it or by search for it by its name
- the selected station is highlighted and a pop-up with station information is displayed
- an isochrone map with the selected station as center point is generated displaying travel times along the network
- on the left hand side the user can pick different options for the display of the isochrone map
The design was inspired by the Chronotrains project website by Benjamin Tran Dinh and Sarah Mamy (see below). As we quite liked their design we hope our end result will look at least somewhat similar to the Chronotrains website, although we do not plan on adding suggestions.
Research questions
This leads us to the research questions this project should answer.
How well / quickly can you get around in Zurich using trams?
How centrally are individual tram stops located?
How to motivate more people to use public transport in cities?
Methods
For this project we used the two geodatasets mentioned in the Data sources section (public transport stops and network) and imported them into QGIS. There, they were first filtered, to only include the stops containing information about the city of Zurich and referring to trams. As our focus lies on the city of Zurich itself, the 219 stations connected to the city's tram network were reduced to only the stations within the city limits. This was done by selecting only the 186 stations in the ZVV fare zone 110, which is defined as the city of Zurich. By this step, we managed to remove all communities which are connected to the tram network and truly focus on Zurich itself. The number of stops was further reduced to 49 we judged most important, including terminal stops and all stations where lines meet or split. This step was conducted manually by visual selection based on the tram network. This was done in order to allow for the greatest possible resolution while using the smallest amount of data possible.
Another thought was to minimize computing power needed to display the final map, although most calculations were already done beforehand. To furthermore minimize computing power, the original network was simplified using the QGIS "Simplify" algorithm with a toleance of 10m. This way the required storage for the entire network could be reduced by a considerable factor. The data, delivered in the Swiss Coordinate Reference System (CRS), had to be reprojected to the web-standard World Geodetic System 1984. In our opinion the travel times from the unused stops can be approximated from the nearest displayed stop, as there will not be any major differences as the line and track used are identical. Using the QGIS network algorithm "Service area (from layer)" for each individual stop chosen, the service area could be calculated for all 6 time intervals at once. In order to approximate the average distance covered by the trams in 5 minute intervals, we chose an average speed of 15.6km/h, which was implemented as the equivalent distance of 1300m covered in 5 minutes, which made the calculations easily scalable. This number appeared in multiple literature sources1234 and newspaper articles567. Based on this approximation the following travel time intervals were calculated using QGIS' model builder: 5min (1300m), 10min (2600m), 15min (3900), 20min (5200m), 25min (6500m), 30min (7800m) (see figure below). All the resulting service areas along the network were then saved as shapefiles, to facilitate integration with the ArcGIS functions. However, this would not come to be, as we encoundered difficulties while trying to implement our vision with the ArcGIS webmapping tools. Therefore, we changed our approach to use R shiny instead.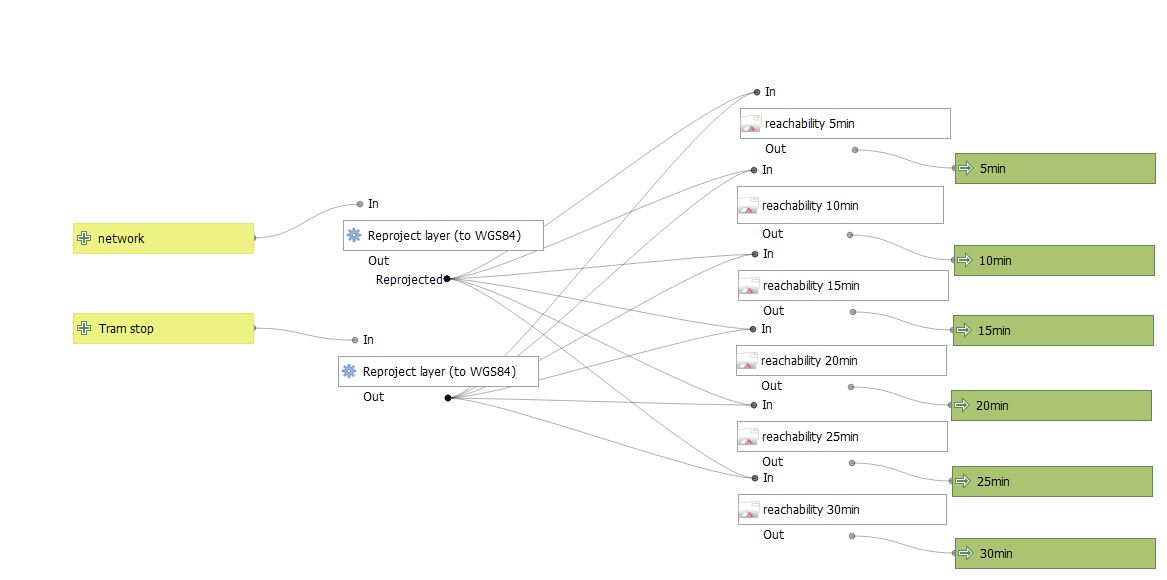 QGIS model used for service area calculations