Data Description
The geospatial data used in the project were exclusively downloaded via the federal open data platform “opendata.swiss”. We used the latest available versions as of 26.02.2025. As a base to calculate the renewable power capacities per capita for a community, we needed the data set “Elektrizitätsproduktionsanlagen” (electricity production plants) from the “Swiss Federal Office of Energy” (Bundesamt für Energie BFE, 2021). The community boundaries and their number of residents was derived from the data set “swissBOUNDARIES3D” from the “Federal Office of Topography swisstopo” (Bundesamt für Landestopographie swisstopo, 2025b). Finally, we used the data set “Energiestädte” (energy cities) of the “Swiss Federal Office of Energy” to identify energy cities (Bundesamt für Energie BFE, 2014).
Methods
The website was set up using HTML markup language. The web map was created with “ArcGIS Pro” and “ArcGIS Online”, the implementation was done by using “ArcGIS Experience”. The tools for statistical comparison of communities were realized with “R-Shiny”.
Map Design
To ensure a user-friendly web map that follows the basic rules of cartography, the following principles according to the course GEO 123 at the University of Zuerich and additional literature were considered and adapted as far as feasible:
- Three pillars of map design: Theme? Audience? Purpose? (Fabrikant and Goldsberry, 2005)
- Size is generally the most powerful visual variable (Roth, 2017).
- Visual hierarchy must be considered to separate and display information (Slocum et al., 2014).
- A more saturated hue and warmer colors are associated with stronger / higher values (Roth, 2017).
- The “ColorBrewer” seems to be best suited to display geospatial information and take color blindness into account (Harrower and Brewer, 2003).
- To display relative data geospatially, a choropleth map is basically suited best. For numerical (ratio) point data, it seems to be a proportional symbol map (Slocum et al., 2014).
How we followed each of these principles in the project will now be explained briefly. First, the “three pillars of map design” were defined:
- Theme: Differences between Swiss Energy Cities and non-members in the installed capacity of photovoltaics, wind and biomass power production per capita and in total; hydropower to be considered for some more context.
- Audience: Communal politicians, energy experts, sustainability consultants, members and associates of the label Energy City, and particularly interested citizens.
- Purpose: Examine which communes are ahead or behind and if there is an impact of the Energy City label on new renewable power production capacities.
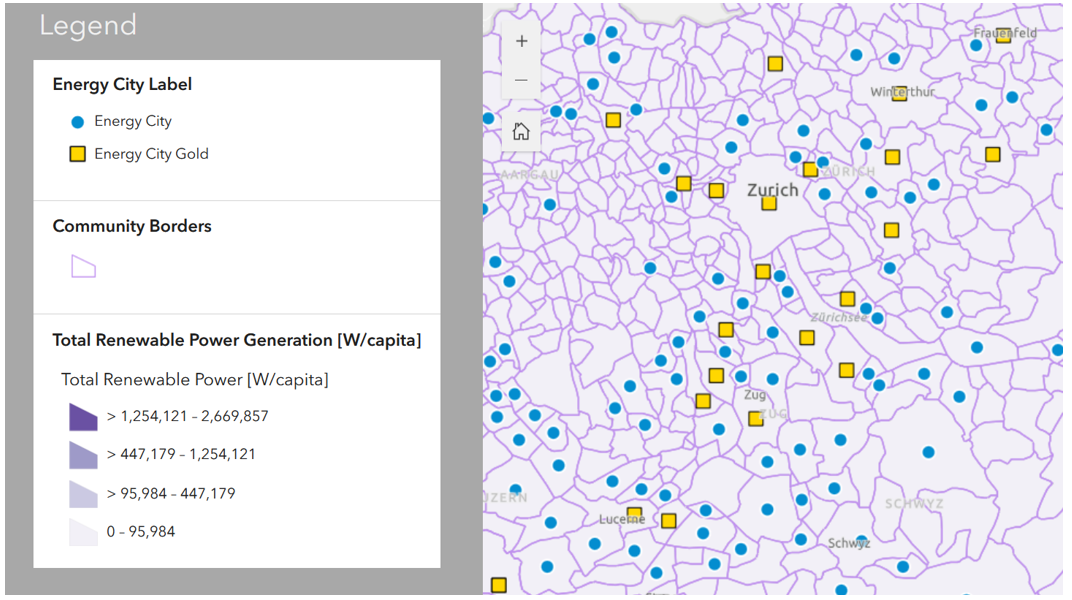
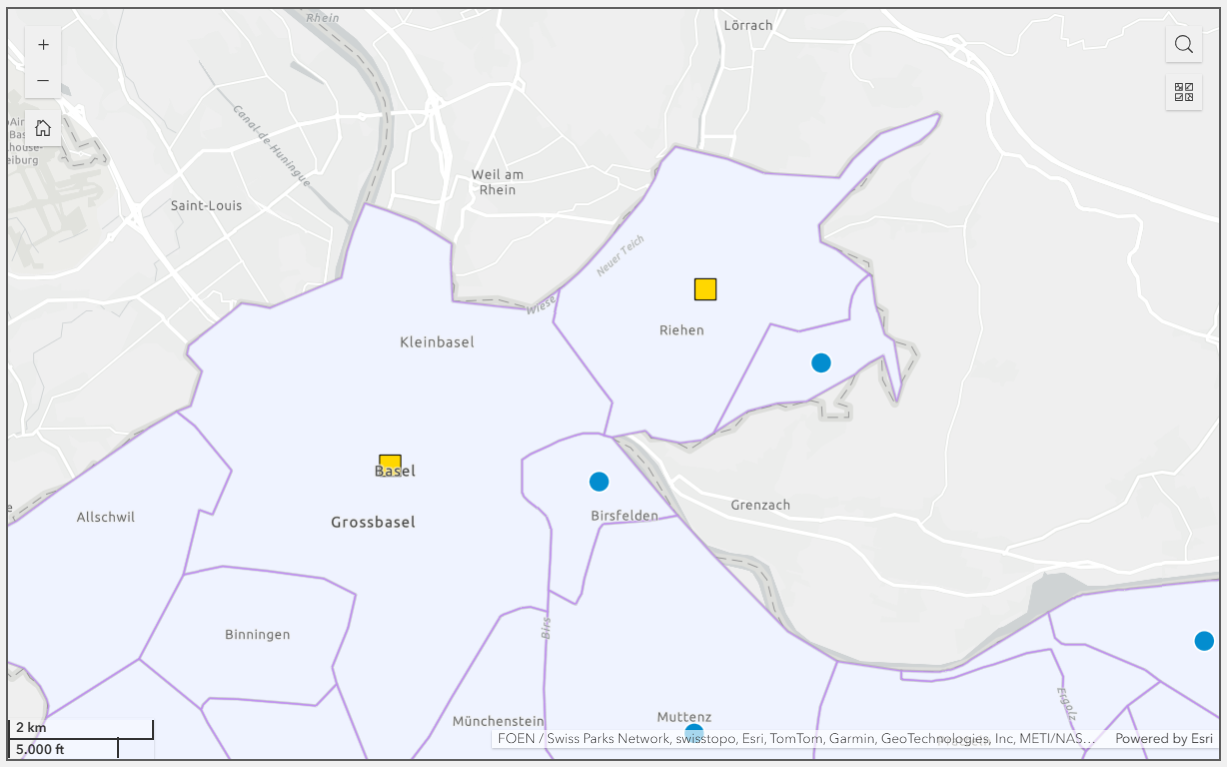
To follow these 3 pillars and the principles above, our map contains a layer to depict the Swiss Energy Cities and community borders to deliver a quick overview and orientation. The symbols for energy cities followed an ordinal data type and were divided into two categories: “regular energy city” and “energy city gold” (Trägerverein Energiestadt, 2025a). Since more saturated hue and warmer colors are generally associated with stronger attribute values (Roth, 2017), the filling color for the regular energy cities consisted of the blue included in the logo of the energy city label. For the gold members, a warm yellow was chosen. To prevent any visual conflicts with underlaid map layers, a rendering was applied: White for regular members, black for gold members. For even better separation, two different shapes were chosen: Circles for regular members and squares for gold members. The color to render the community borders was defined in a way that prevents possible conflicts with any possible base map or layer. We found out that the color in the similar layer at “map.geo.admin.ch” fitted quite well and decided to implement it (Bundesamt für Landestopographie swisstopo, 2025a). Since the whole project is about energy cities, according to visual hierarchy they are displayed as the top layer and thus cannot disappear underneath others.
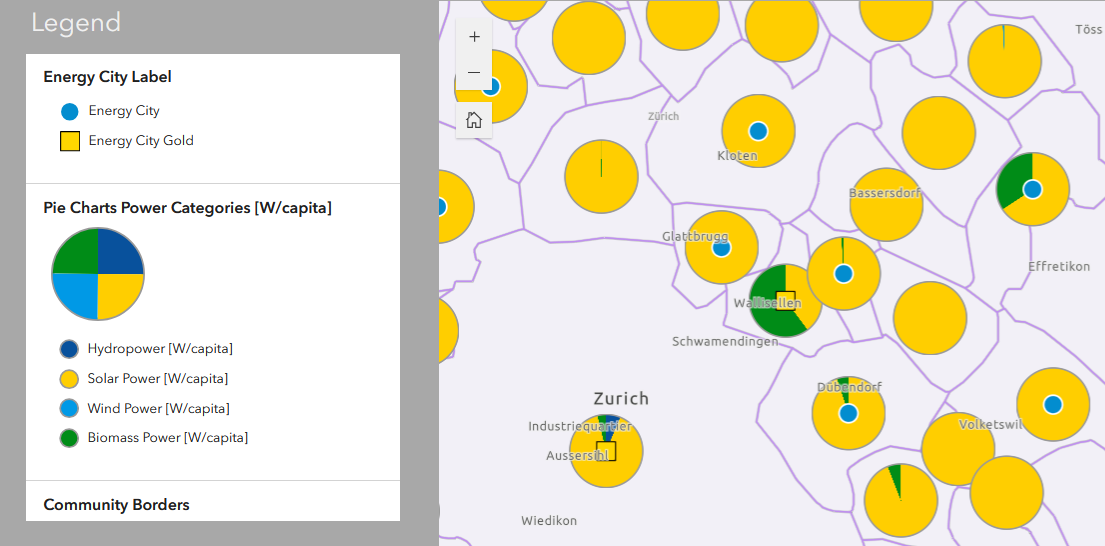
First, the numerical ratio data of overall installed renewable power capacity per capita for each community were considered as a proportional symbol map. This was a compromise to visualize the distribution of each production type in one pie chart per community. But due to large differences within the data, especially regarding hydro power, the proportional size had to be canceled. Large outliers distorted the distribution of size, leading to mostly small sizes with only a few very large ones. Resulting visual conflicts led to limited readability and disturbing overlaps. Therefore, the pie charts are uniformly sized and just depict the shares of renewable power types, and size is unfortunately left out as an individual visual variable. Furthermore, it was decided to show them just at a certain zoom level to prevent excessive overlaps.
For the individual production types and their installed power capacity per capita, choropleth layers were created. We classified the data as quantiles in four classes and adapted the color scale to reduce change blindness and improve the understanding of the data (Osaragi, 2008; Goldsberry and Battersby, 2009). Our original natural breaks classification led to unsatisfying separation in several categories, where some extreme outliers basically led to a uniform color across most of the other communities. The quantile classification with four classes showed the best diversity in colors. The color of the maximum values is consistent with the colors of the equal category in the pie charts. In general, it was tried to select the colors according to the “ColorBrewer” and with color blindness in mind (Harrower and Brewer, 2003), but in the end, we adjusted some values to enhance contrasts. We defined ourselves which ones seemed to be the “most intuitive”: green for biomass, yellowish for photovoltaics, dark blue for hydro power and light blue for wind power. The colors were chosen to be distinguishable from each other, so we did not implement similar color hues for different categories.
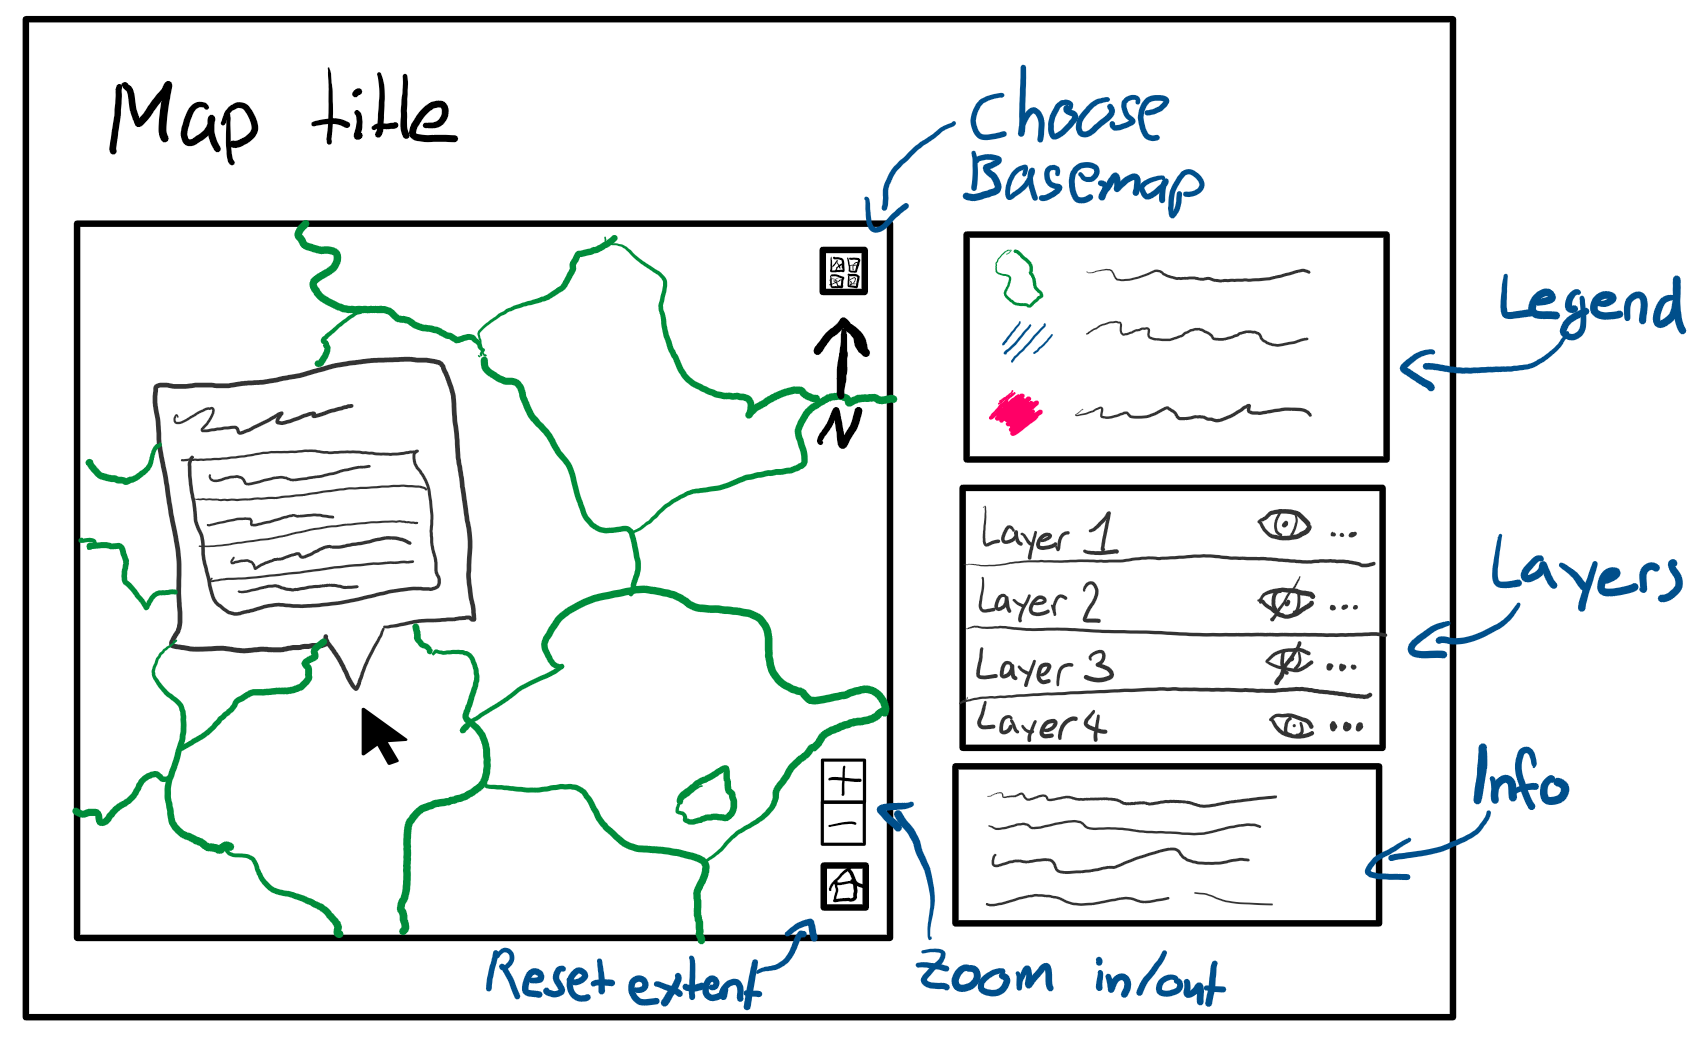
In general, all available information for each community can be depicted by clicking on one, opening a pop-up table. The layer selection and legends were placed on the left and right side (image shows our first map sketch in the planning phase). To prevent confusion and unnecessary maneuvering/scrolling in the box, only the legends of the activated layers are shown.
In the statistical section below the web map, two simple tools to enhance interactivity and make comparisons between individual communities possible were implemented with “RShiny”. The users can select two communities, and after that, one receives a comparison with bar charts and can see the compared values for renewable power capacity per capita and which energy city status the communities have. In the second tool, one can conduct statistical analyses on the overall data of the three community types. Each renewable power type can be included or removed. The result is a boxplot with p-values to examine if there is a significant difference between regular energy city members, gold members and non-members. To not overload the web map section, we realized these tools in a separate section.
Data Limitations and Problems
There are several limitations regarding the data used. First, the overall selection criteria for a community are clear and renewable power production and its promotion and support on community level are criterions (Trägerverein Energiestadt, 2025b). However, it is not clear how the evaluation scheme for each criterion looks exactly. For example, especially some large hydropower plants are much older than the label and have a huge impact on communal statistics. But it is unknown what their impact on the actual label selection process was. Furthermore, communities have to actively apply for the label (Trägerverein Energiestadt, 2025a). Since renewable power production is by far not the only criterion of interest to get the label, the impact of high renewable power on the overall selection process may be minor. This could lead to some bias, since also energy cities with lower power production are considered, but this is basically part of our research question to show the actual impact or weakness of the label here.
To encounter this challenge partially, we included an option to exclude hydropower stations larger than 300 kW in the statistical comparison tools. They seem to be much less related to the communities’ scope of action, in contrary to small plants. We would have liked to also drop hydropower plants older than 1990. But it was realized too late for preprocessing the data and it would have been necessary to change and redo the whole preprocessing of the data again. Therefore, they were left in the data. The same applied for the choropleth map, where no differentiation of hydro power plant sizes and building dates was possible afterwards. Furthermore, it was then not tried to show the total renewable energy production anymore in the pie chart size, because large hydropower plants distorted the whole scheme. It has also been suggested to additionally show the relation of renewable power generation to non-renewable power plants for each community. After considering this possibility, we found that just 104 non-renewable power plants do not give more meaning or understanding to our map. Additionally, what needs to be differentiated is generation and consumption of energy.
Another data-related problem is the loading time of the web map. As a main problem here, the very detailed community borders were identified. To reduce their resolution and improve the loading time, we applied a polygon simplification algorithm in ArcGIS Pro. The “retain critical bends” algorithm identifies and eliminates relatively insignificant bends to simplify data for display at smaller scales (Wang and Müller, 1998).
Between the data sets, there were some inconsistencies and some difficulties while processing them occurred. For instance, some of the communities in the data sets of energy cities and electricity production plants were labeled differently. Furthermore, some energy cities did not consist of just one community, but of several. Consequently, some manual corrections were conducted to eliminate severe errors and gaps. On top of that, several data errors or gaps were detected in the web map after a brief qualitative analysis. Since the focus is on the design and visualization, we decided not to put very substantial efforts beyond the scope of this project into further corrections of minor data errors. Thus, we cannot guarantee complete correctness of depicted information.