Results
The statistical comparison tool for overall communities allows for the quantitative assessment of non-members compared to energy cities. If there is a resulting p-value below 0.05, this indicates a significant difference between compared groups. However, this does not explain which group contains significantly higher values. For that, one needs to compare the groups and especially their medians and means separately in a qualitative manner. The following results only represent the main categories. Combinations of them can be conducted individually.
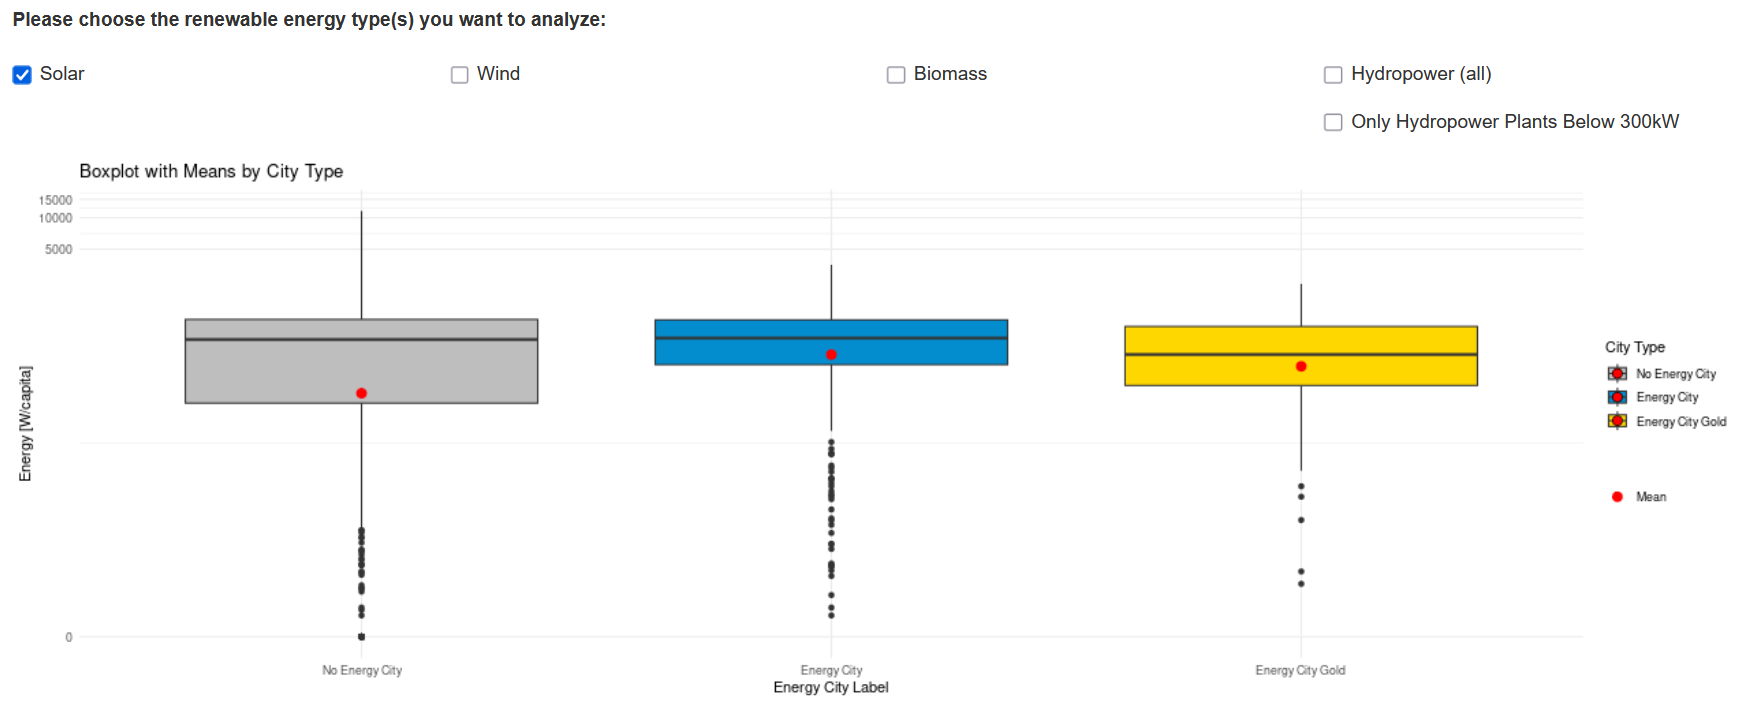
Of the solar power groups, only “Energy City” and “Energy City Gold” differ significantly, with the latter showing a lower mean and median. Regarding the wind category, “Energy City” and “Energy City Gold” differ significantly, as do “Energy City Gold” and “Non-Member”, but a qualitative assessment is not feasible due to very close means and medians. According to the comparison of the biomass groups, all show a significant difference between each other, with “Energy City Gold” showing the highest mean and “Non-Member” the lowest. Comparing the groups containing all hydropower plants, there is also a significant difference between all of them and a pretty similar outcome to the biomass comparison. If only hydropower plants below 300 kW are considered, there is no significant difference between “Energy City Gold” and “Energy City” anymore. In both cases, “Energy City Gold” shows the highest mean value. If we look at the total renewable power, there is only a significant difference between "Non-Members" and "Energy City", with "Energy City" having a higher mean value.
Discussion
Based on the map only, it is rather difficult to find statistical answers to our research questions. Individual, qualitative comparisons between selected communities can be conducted by the map users with the first statistical comparison tool or visually by checking the map and pop ups. Many communities are very small in size, especially in the "Mittelland”, which makes the differentiation rather difficult in some cases.
Put together, we find certain significant differences between members and non-members, showing that label-members have a higher renewable energy production. Overall, from out statistical analysis tools it does not seem like there are significant differences between the label members.
Although there seem to be statistically significant differences, further research to prove the empirical connection would be necessary. This would include the temporal aspect and specific connection to federal, cantonal and communal support and subsidy programs. Otherwise, it is not possible to certainly exclude the possibility of other factors being more important than the label itself and the statistical correlation we found might be just by chance. As already mentioned in the data section, the data is not refined perfectly and thus contains several missing power plants and other data errors. The resulting statistical values should thus be interpreted with this in mind. A further and complete data refinement was out of scope of this project.
Apart from data related limitations, discussed in the data section, presented approaches come with several other boundaries. For instance, it is very difficult to hard prove a real connection between energy city memberships and renewable power production capacity. Since the project focus was on the web map design, a geospatial analysis for example on advantageous conditions like amount of favorable roof space for solar energy in each commune was left out. Furthermore, non-renewable power plants like nuclear reactors, waste incineration or natural gas power plants were removed from the data and thus not considered or set into context, since they were not a key part of the project aim.
Technical and Visual Challenges
There occurred several technical challenges. We faced trouble due to strict caching in browser (mainly Firefox), especially after updating and reloading the page multiple times in a short period of time. Thanks to some HTML tricks, we could work around that. Unfortunately, it is not possible to check without any doubt whether all browsers now work correctly. Creating the map with ArcGIS Online also turned out to be challenging since the operating possibilities are limited in certain parts and options are often hard to find. This concerns especially editing rights, calculating fields and changing names in combination with limited experience with this software. Thanks to the ESRI webpages these problems could be solved successfully.
The color appearance of the map seems to be fulfilling the basic principles of cartography mentioned above. Problems for color blind people should not occur, and visual contrast seems to be intact, but somehow depended on the chosen base map. But since we created the Web map on ArcGIS Online, we were limited in color options for our map, which lead to unsatisfactory color combinations at first. A critical visual characteristic that could be improved are the lowest values of each choropleth layer. Now, they contain a filling color mostly. Excluding this and just showing the base map below could make orientation easier and enhance the visibility of communities with higher values.
The layer with pie charts activates only at a certain zoom level to avoid obsessive overlaps. It can be debated whether the size of the pie charts and their activation level is appropriate, since there are still notable overlaps in some areas. As mentioned earlier, the pie charts are furthermore equal in size. The implementation of this visual variable according to the total value of renewable power capacity per capita could have enhanced the information visualization and intuitiveness. But the smallest charts had to be rather big, so that their information is still visible behind the symbols of energy cities, which again complicated the scaling of the pie charts themselves.
Conclusion
The web map and implemented statistical tools allow to compare the communities of Switzerland regarding their renewable power production and relates that to the energy city label. Our stated research question can be answered, but the evidence of an empirical connection is still not completely clear, and several issues remain, especially in the displayed data. Nevertheless, our approach could be useful for the target group to compare specific communities relatively and support political discussions and advances. It could serve as the basic concept for further, more refined maps regarding renewable energy production, energy efficiency and climate neutrality in general that accounts for further variables.