Key Findings
Our analysis of the spatial data revealed several interesting patterns and correlations. Below is a summary of our primary discoveries.
Visual findings 100x100m demographic layer
The selected map sections reveal several recurring spatial patterns between foreign population share and environmental noise exposure in Zurich. In multiple areas, zones with a high foreign population share are located along major traffic corridors and transport hubs, where noise levels are also particularly high.
In the Altstetten area (see Figure 1), this pattern is especially visible along Badenerstrasse and around Bahnhof Altstetten. In contrast, surrounding neighbourhoods such as Höngg, as well as statistical zones like In der Ey, Mühlezelgstrasse or Buchlern, show relatively high noise levels but lower foreign population shares. At the same time, some zones such as Dachslenstrasse and Rautistrasse combine high foreign population shares with comparatively low noise exposure. The strongest impression in this section is therefore the sharp contrast between the highly connected Altstetten corridor and the adjacent residential areas.
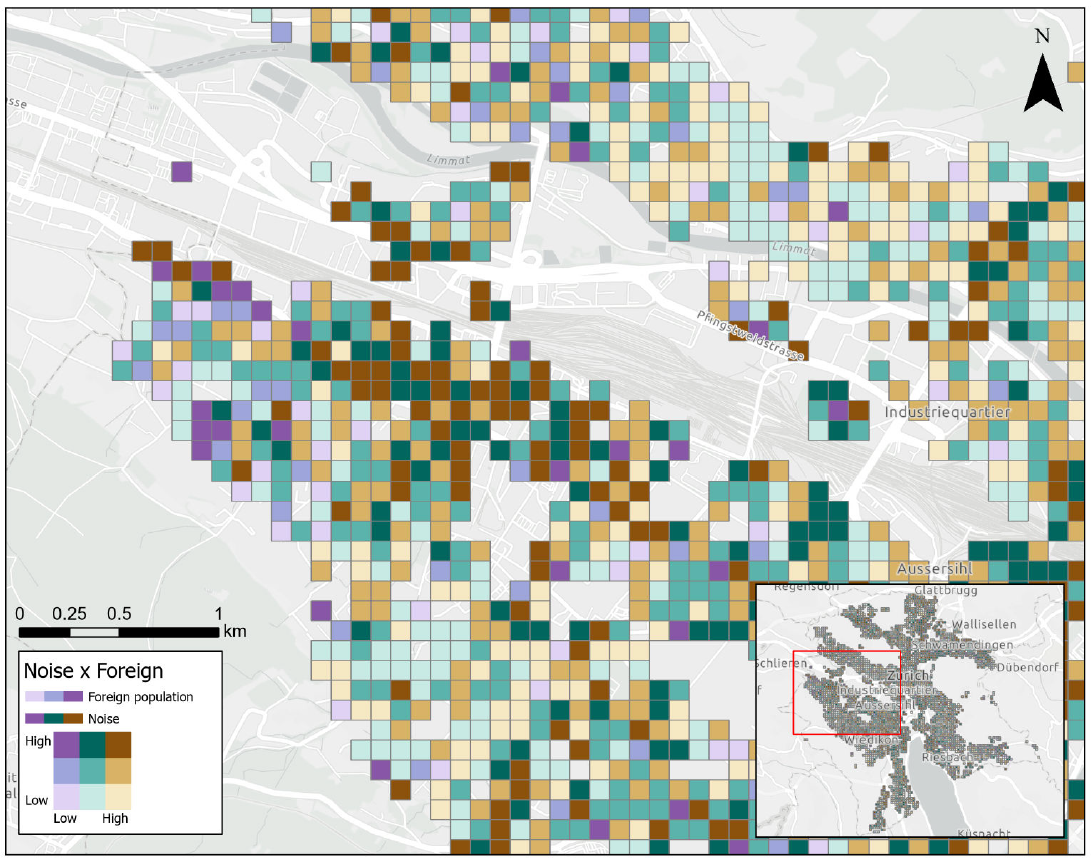
Figure 1: Spatial pattern of the relationship between foreign population share and traffic noise in the Altstetten region.
A similar pattern appears in the Oerlikon section (see Figure 2). High foreign population shares combined with high noise levels can be observed along the Schaffhauserstrasse axis between Milchbuck and Bahnhof Oerlikon, including zones such as Radio-Studio, Steinkluppe, Marktplatz Oerlikon and parts of Seebach and Affoltern. Meanwhile, neighbouring districts such as Oberstrass, Unterstrass and Wipkingen also experience elevated noise levels, but generally show lower foreign population shares. This suggests that noise alone cannot explain the observed distribution.
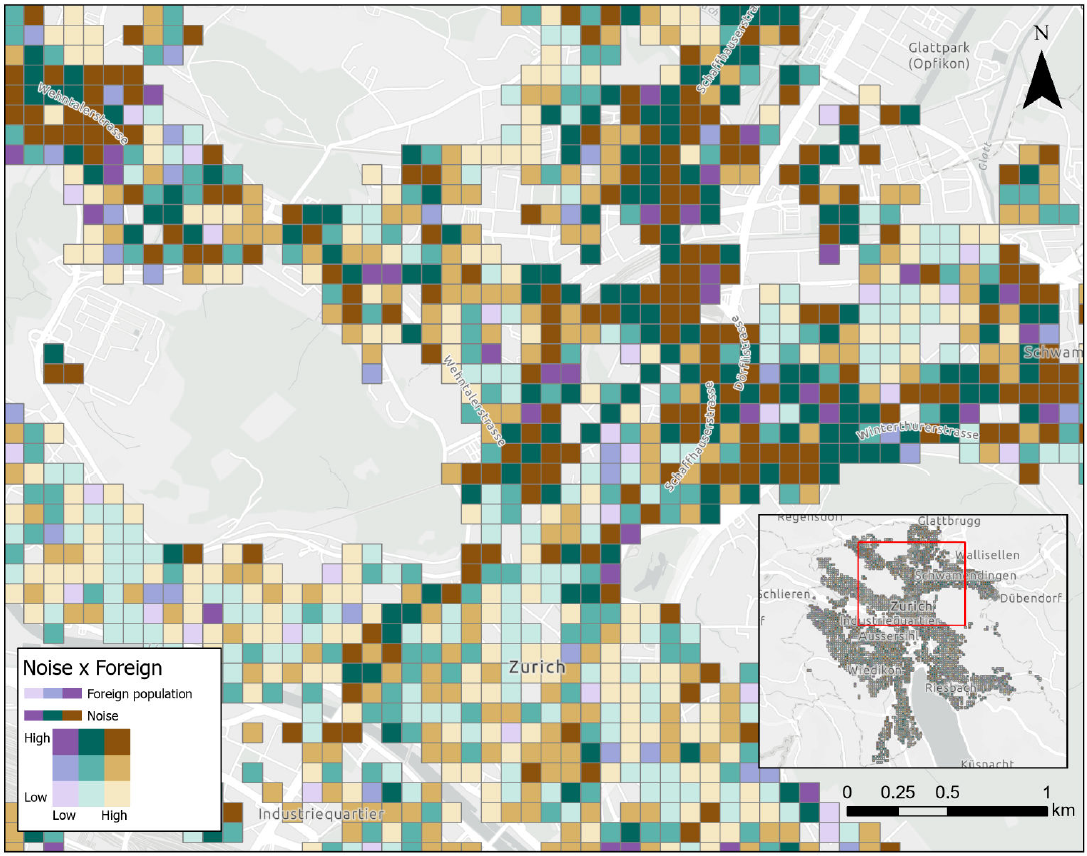
Figure 2: Spatial pattern of the relationship between foreign population share and traffic noise in the Oerlikon region.
In the city centre (see Figure 3), mixed patterns become visible. Areas such as Langstrasse, Enge or parts of Seefeld show both high noise exposure and high foreign population shares, whereas districts like Hottingen, Fluntern and Hirslanden display relatively high noise levels but lower shares of foreign residents. Similar tendencies can also be observed in Sihlfeld and Alt-Wiedikon.
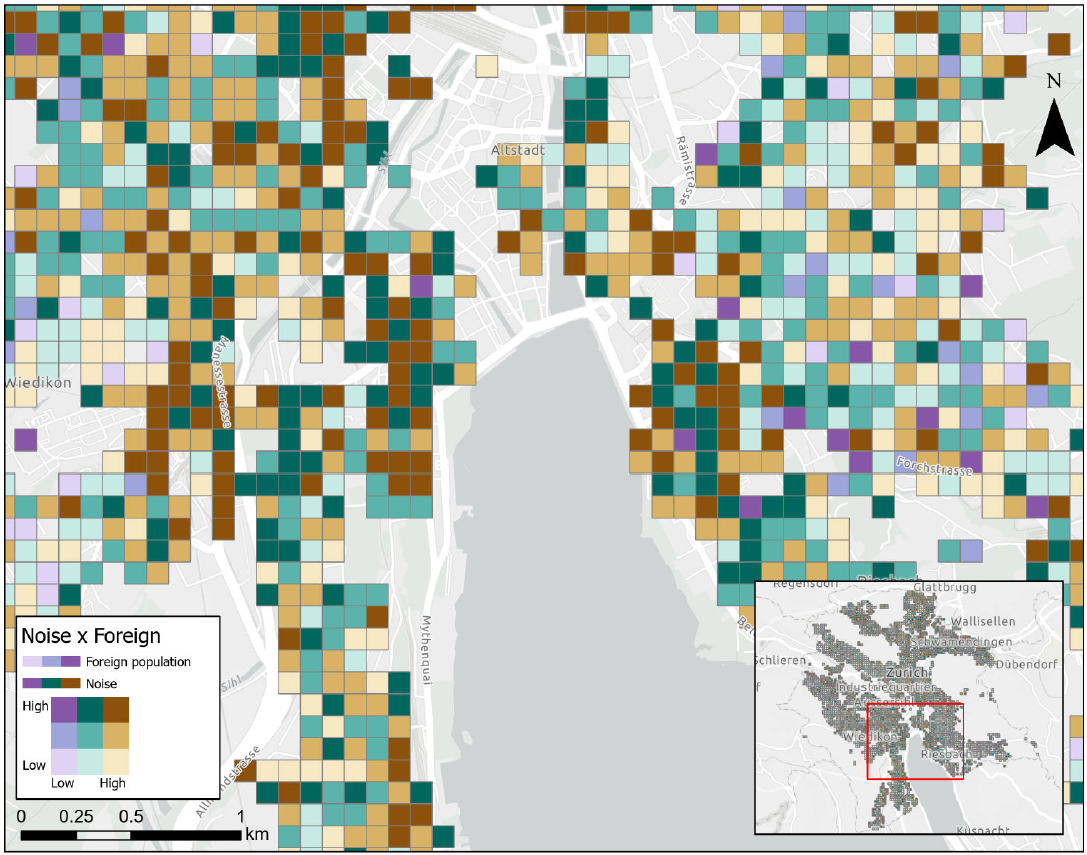
Figure 3: Spatial pattern of the relationship between foreign population share and traffic noise in the city centre.
Overall, the maps indicate that the relationship between noise exposure and foreign population share is likely influenced by broader urban and socio-economic factors. Areas with high accessibility, dense transport infrastructure and lower or more mixed housing prices may attract larger proportions of international residents. Importantly, the category "foreign population" does not only include traditionally understood migrant populations, but also expats, international professionals, students and other non-Swiss residents. The observed patterns therefore reflect not only potential socio-economic inequalities, but also Zurich's role as an internationally connected economic centre.
Visual findings district layers
The map suggests that noise exposure in Zurich is concentrated in a few clear districts rather than spread evenly across the city. The most affected areas appear to be Altstetten, Escher Wyss, Sihlfeld, Gewerbeschule, City, and Unterstrass, which stand out as the strongest noise hotspots. What makes this especially interesting is that these districts are also tied to broader urban functions like major roads, transport corridors, and dense development. That means the pattern is not random, it seems closely connected to how the city is built and used.
A second important finding is the overlap between noise and social vulnerability. Altstetten, Hard, Sihlfeld, Gewerbeschule, Oerlikon, and Schwamendingen-Mitte appear to combine higher noise with higher welfare dependence, which suggests that people in these areas may face a double burden of environmental exposure and limited resources.
The patterns for age and education are less direct. Districts such as Höngg, Fluntern, Hottingen, Hirslanden, and Witikon do not line up as clearly with the noise zones, which implies that these factors are not the main drivers of the spatial pattern. The foreign population layer shows some overlap in places like Oerlikon, Schwamendingen-Mitte, and the inner-west district as like Escher Wyss and Altstetten, but the relationship is not uniform enough to make a simple claim.
Overall, the map layers tell a story of unequal exposure. Noise seems to cluster in the inner-west and northern parts of the city, while quieter and more affluent residential districts remain more separated from those burdens. That makes the map useful not only for showing where noise is highest, but also for highlighting where environmental inequality may be strongest.
Statistical Findings for district layers
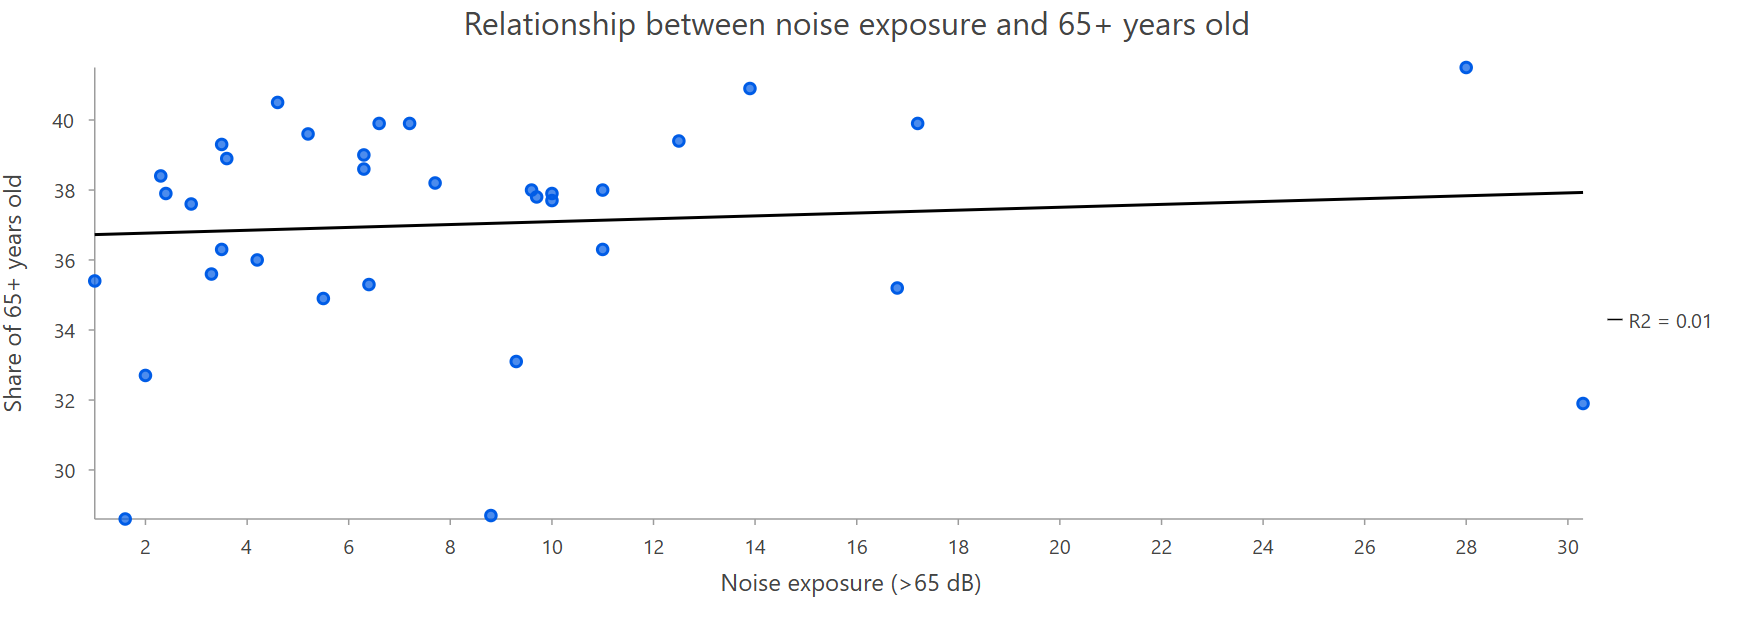
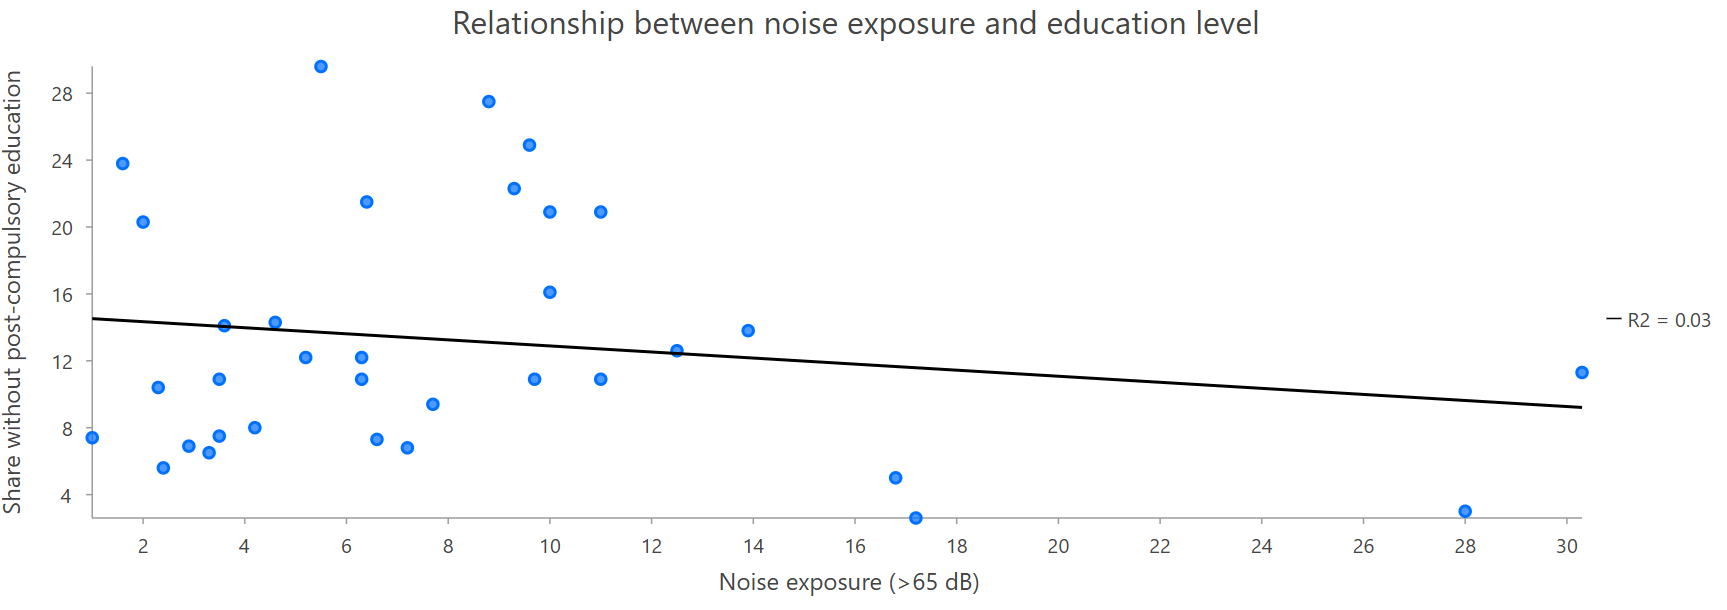
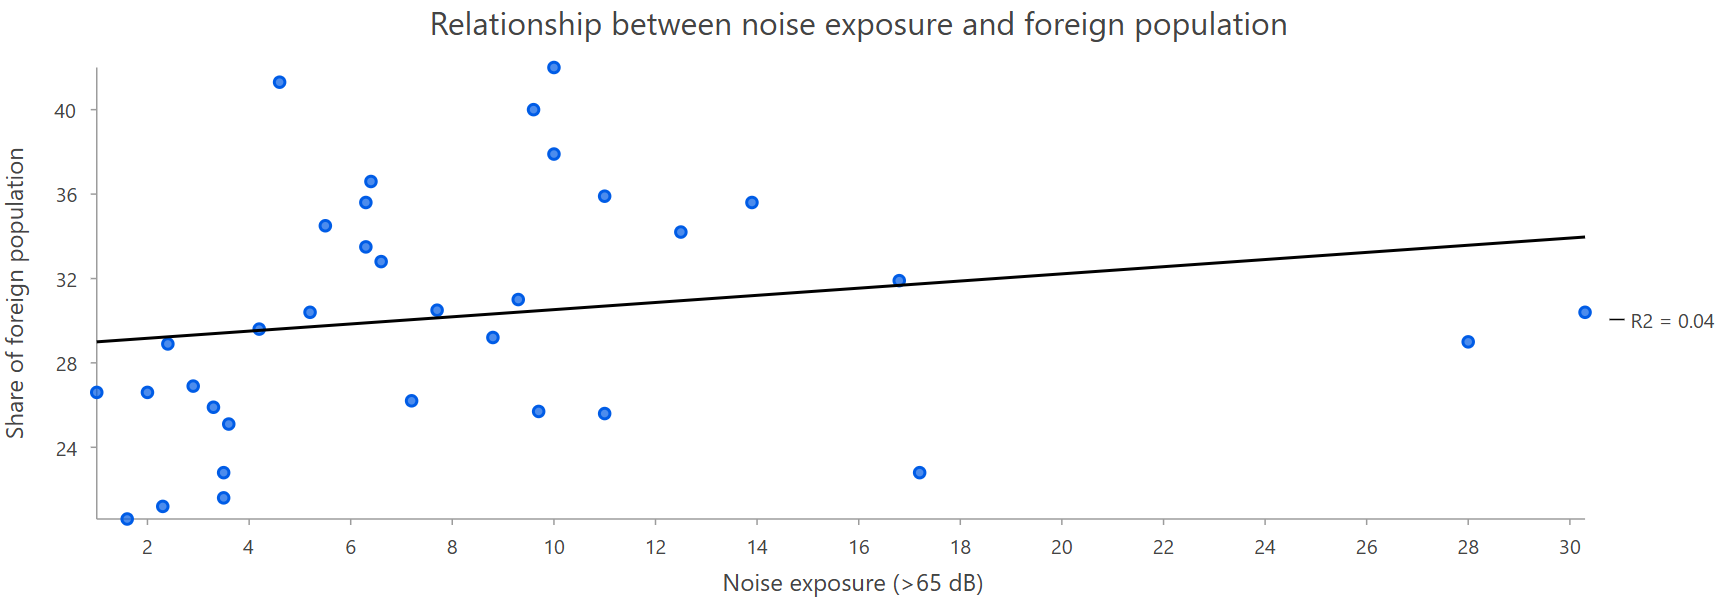
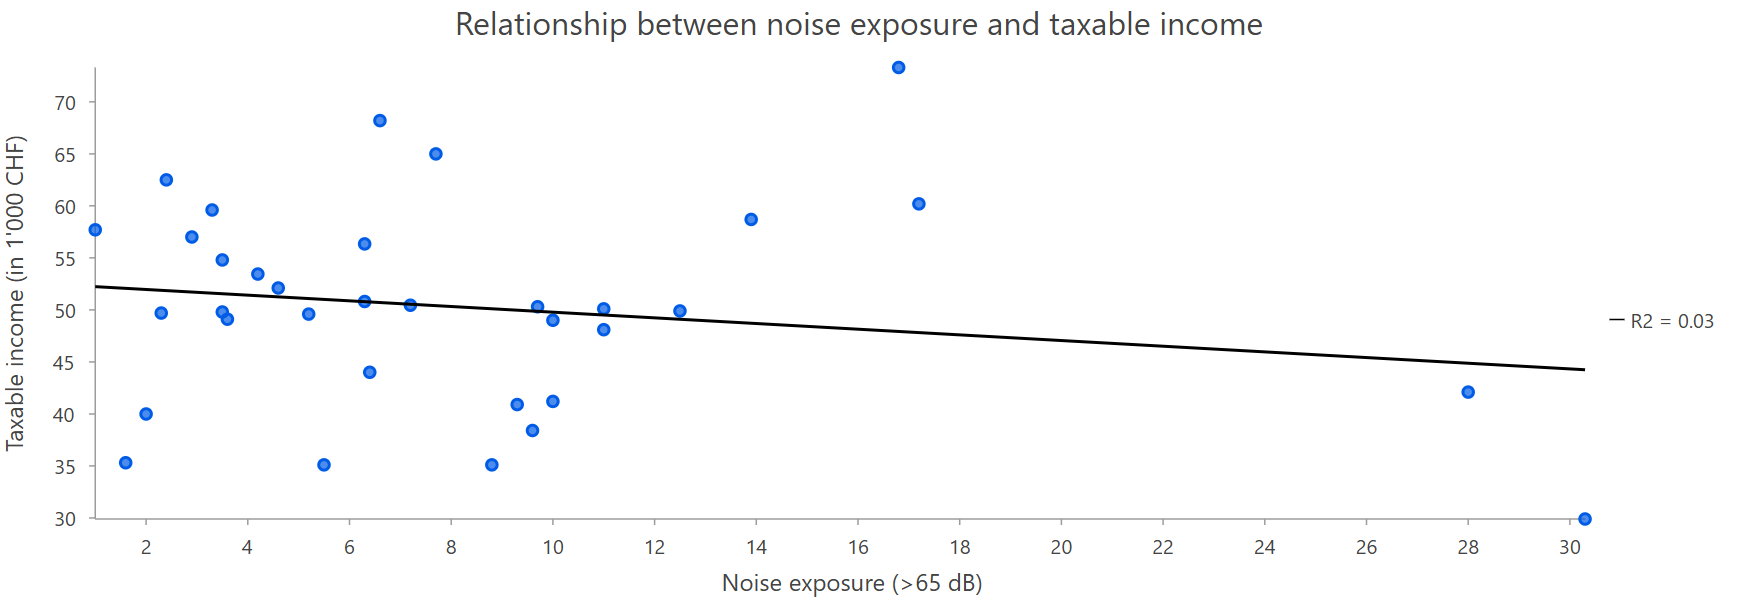
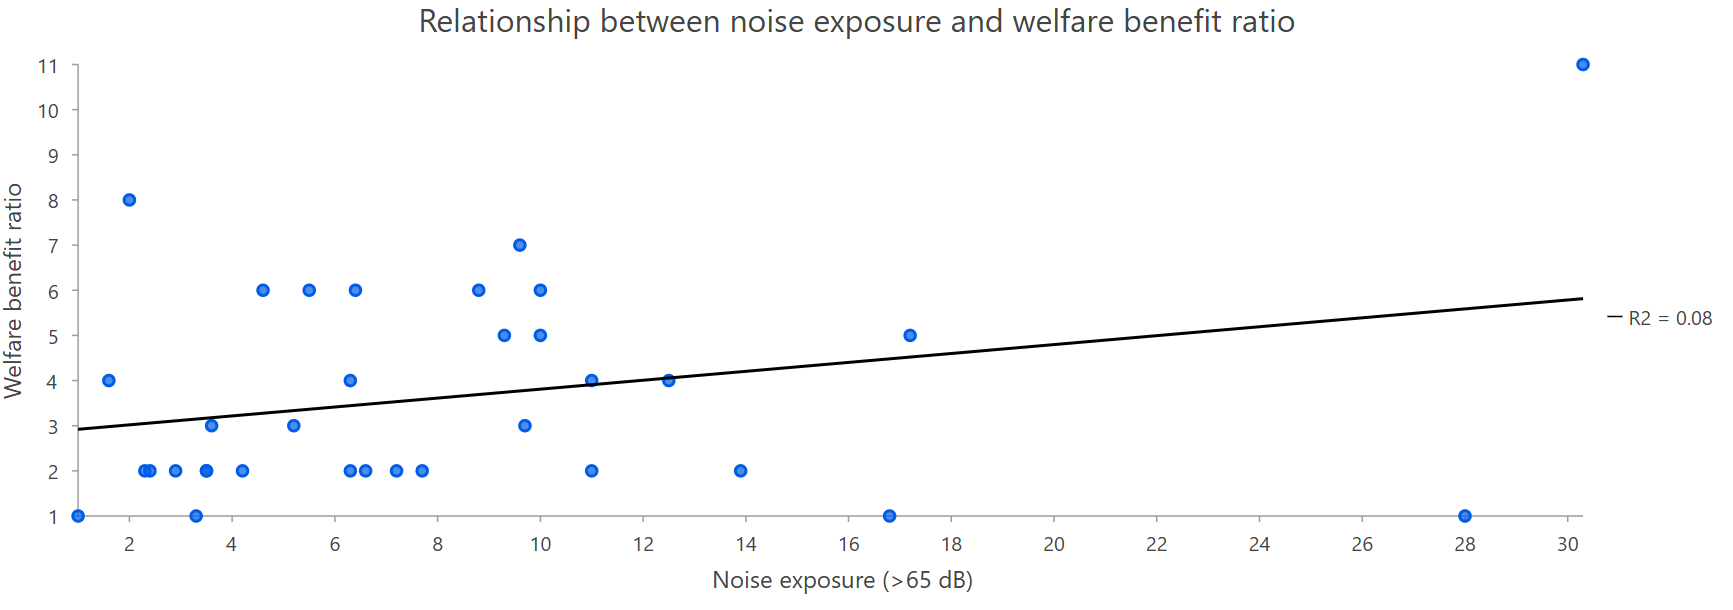
Pearson correlation analyses indicate that the relationships between noise exposure and the socio-demographic variables are generally weak at district level. The strongest association is found for the welfare benefit ratio, which shows a weak positive relationship with noise exposure (r ≈ 0.28). Foreign population share also shows a very weak positive relationship (r ≈ 0.20). Taxable income and the share of residents without post-compulsory education both show very weak negative relationships (r ≈ -0.17), while the share of residents aged 65 and above shows almost no linear relationship with noise exposure (r ≈ 0.10).
Among the variables, the welfare benefit ratio shows the clearest upward tendency with increasing noise exposure, although the explained variance remains low and the point cloud is widely dispersed. Taxable income displays a weak negative trend, suggesting slightly lower income in more noise-exposed districts, but again the relationship is modest and not strongly explanatory. The foreign population share and the share without post-compulsory education also show only subtle trends, with the former leaning slightly upward and the latter slightly downward. The age structure plot, specifically the 65+ share, is almost flat, indicating no meaningful linear association with noise exposure in this dataset.
Overall, the scatterplots suggest that noise exposure alone does not explain much of the variation in the socio-demographic indicators. The results are best interpreted as exploratory evidence of weak and uneven associations rather than as support for any strong or causal relationship. This reinforces the value of combining the scatterplots with the bivariate maps, since the visual comparison helps contextualize the weak statistical patterns within the broader spatial structure of the city.