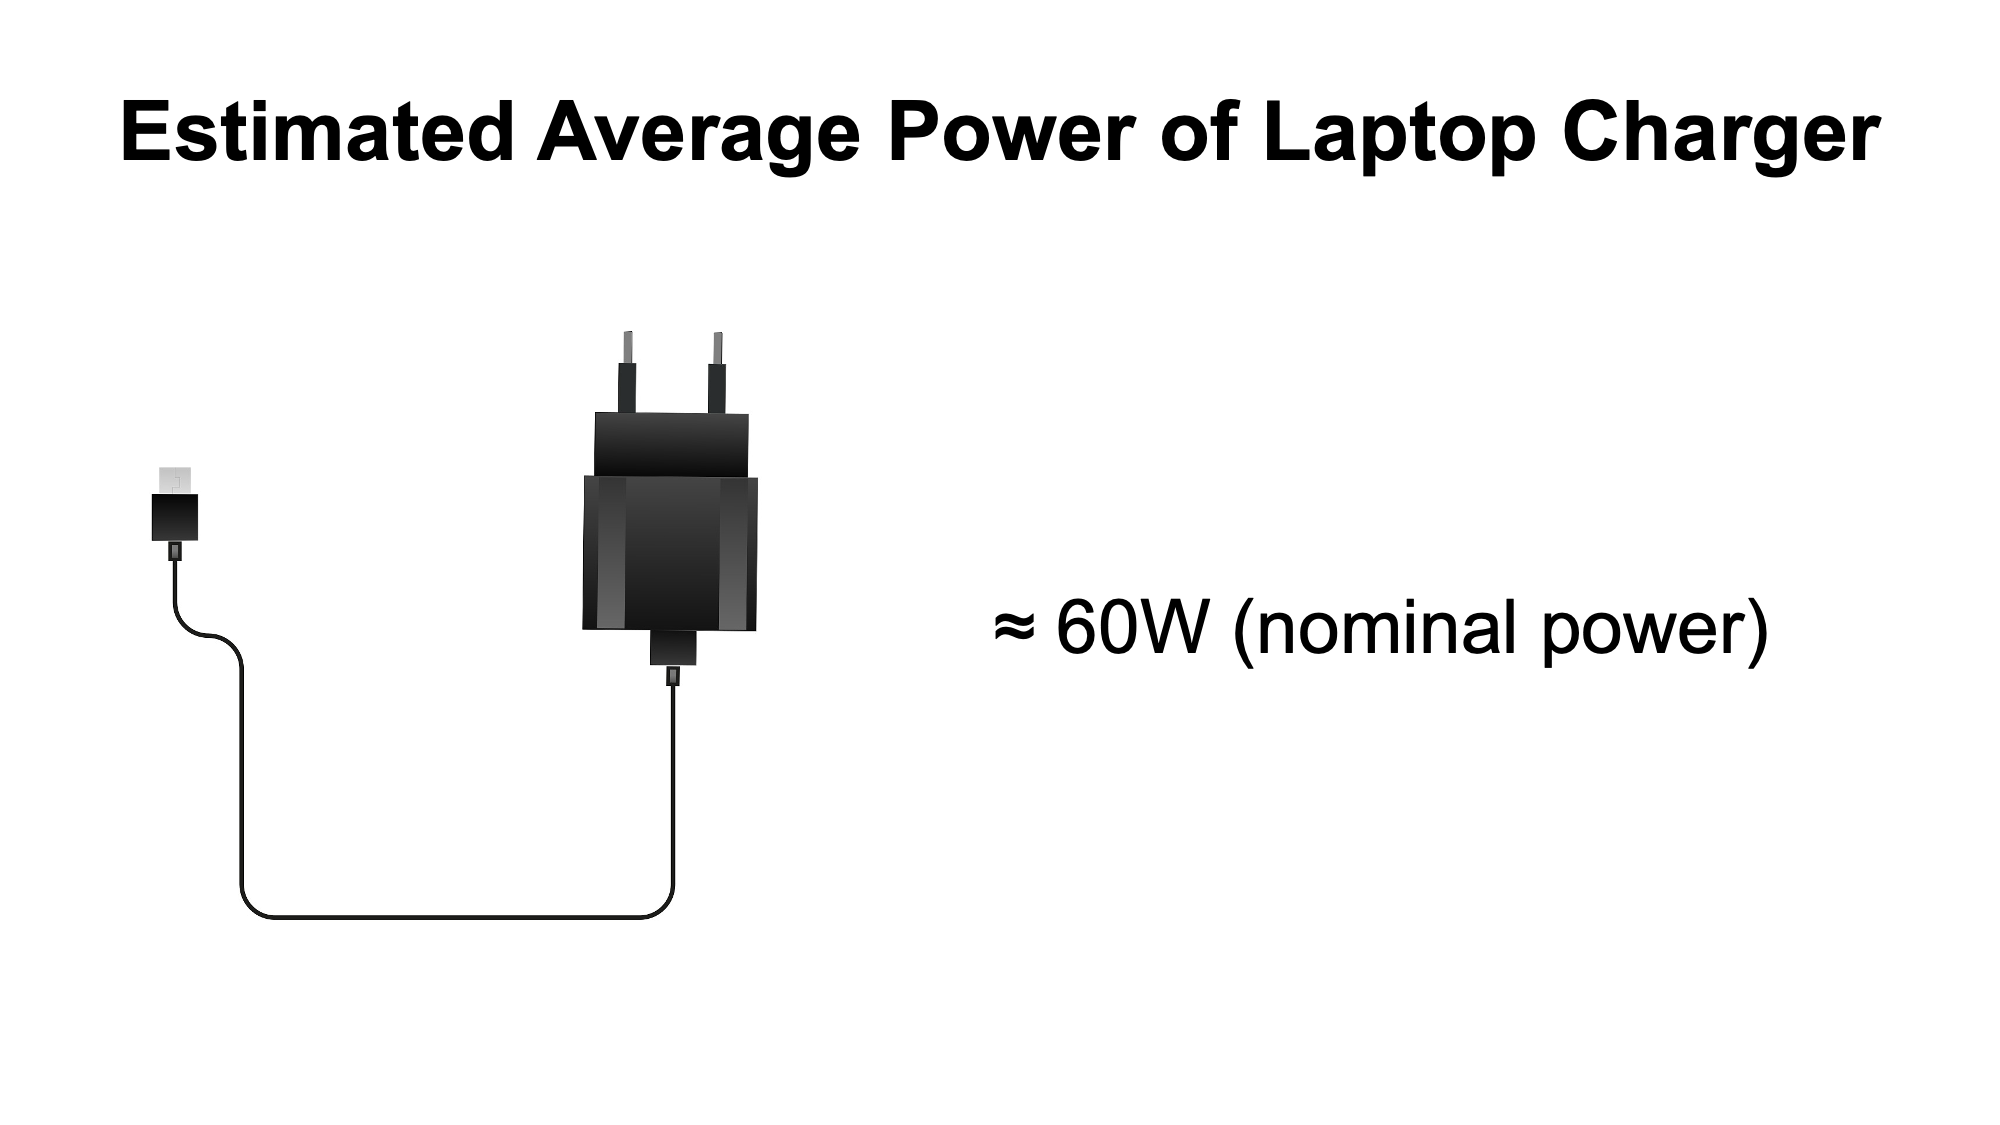
This section contains our map as well as statistical analysis tools. To answer our research question one can observe spatial patterns, leading communities in renewable power generation in the map or check out the statistical comparison tools. To gain a feeling for the energy generation numbers and the unit Watt per capita, the nominal power from a common laptop charger is around 60 Watt for comparison.
Our research question:
"Is there a significant difference between municipalities (cities and communes) of the label “Energy City” and non-members in terms of renewable power production (solar, wind and biomass) per capita?"
Statistical Comparison Tools
The statistical tool on the left site presents the overall distribution of selected renewable energy sources using boxplots and tests whether differences between Energy City label groups are statistically significant. It first checks for normality (Shapiro-Wilk test) and homogeneity of variances (Levene’s test). If both assumptions are met, ANOVA followed by Tukey’s HSD post-hoc test is used; otherwise, the Kruskal-Wallis test is applied. A p-value below 0.05 indicates a statistically significant difference. The direction and magnitude of these differences can be interpreted using the boxplots.
In the box to the right (Community Comparison Tool), you can choose two communities to compare their prodcution rate and population numerically. If you scroll further down inseide this application, you can see a table where the exact numbers are visible.