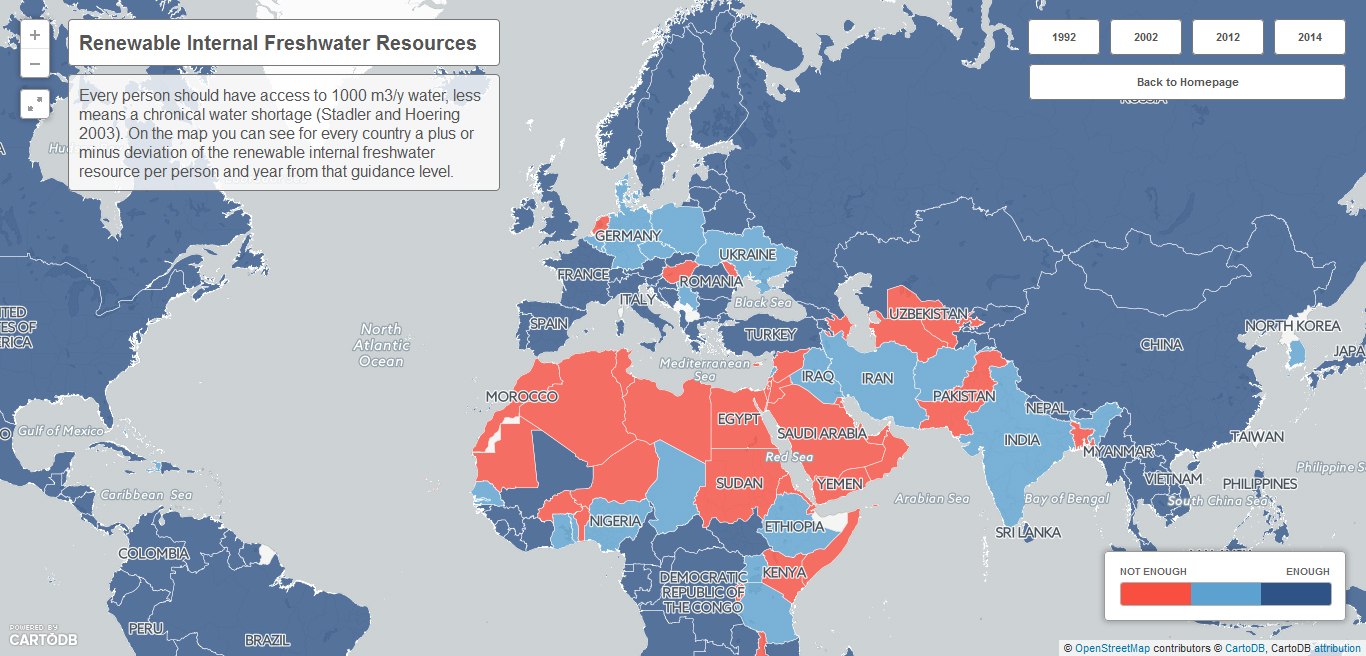
Here you can see our product of the project. Feel free to explore the three maps!
Map 1 is about water supply inequalities. In Switzerland every person consumes more than 50m3 water supplied by water supply industries per year (BAFU). Taking this value as a threshold, with this map you can explore which countries have enough freshwater by supply industries to households.
Map 2 is about the access inequalities to water. You can explore how many percent of the total population, of the urban population and of the rural population has access to water.
Map 3 is about the inequality in natural water ressources. Every person should have access to 1000 m3/y water, less means chronical shortage (Stadler and Hoering 2003). Thus, you can explore internal freshwater resources and see wheter enough water is available.