Background Information
Where does our cotton come from and how sustainable is its journey from farm to fashion? In this project, we take a closer look at H&M’s cotton supply chain through the lens of Sustainable Development Goal 12 (SDG 12): Responsible Consumption and Production. As one of the world’s biggest clothing retailers, H&M has a huge impact on global supply networks and the choices made by millions of consumers. But behind a simple cotton T-shirt lies a complex chain of decisions, impacts, and responsibilities that deserve closer attention.
Our focus is on how H&M sources and processes its cotton, and what that means for the environment, for workers, and for the goal of truly sustainable fashion. A key part of the story is Better Cotton, a global initiative that works with farmers to promote more sustainable cotton production. Through training and support, farmers learn how to save water, reduce harmful chemicals, protect local ecosystems, and respect labor rights. While cotton sourced through Better Cotton can't be physically traced all the way to the product (because of a system called mass balance), purchasing through the initiative still helps drive positive change on the ground. We explore this topic through the framework of three SDG 12 targets. First, Target 12.2 asks how we can use natural resources more efficiently, so we look at where H&M gets its cotton, and what environmental and social challenges exist in those regions. Second, Target 12.4 deals with managing chemicals and waste safely, which leads us to the countries where the cotton is processed, and the standards workers face there. And finally, Target 12.8 is all about awareness and information, so we ask how transparent H&M is in its sustainability messaging, and how effectively it helps consumers make informed choices.
At its core, this project is about asking better questions: not just what we wear, but where it comes from, how it was made, and who was affected along the way.
Research Question and Limitations
In line with Sustainable Development Goal (SDG) 12, we developed a central research question to direct our study using thematic maps.
How sustainable are the consumption and production patterns within H&M’s cotton supply chain in the context of SDG 12?
As SDG 12 comprises several targets aimed at promoting responsible consumption and production, we developed a set of sub-questions to direct our analysis more precisely.
Sub-questions:
- Where does H&M source its cotton, and what environmental and social challenges are associated with these production regions? (Target 12.2: Sustainable management and efficient use of natural resources).
- In which countries is the cotton processed, and how do working conditions and environmental standards vary across these locations? (Target 12.4: Environmentally sound management of chemicals and waste).
- How is H&M promoting sustainable consumption at the retail level, and to what extent is its communication transparent and effective? (Target 12.8: Ensure relevant information and awareness for sustainable lifestyles).
Due to the multidimensional nature of these questions and the complexity of H&M’s sustainability strategy, we opted to develop four distinct maps. These maps enable us to visualise and evaluate specific areas of the supply chain in terms of sustainability practices. We begin by examining cotton cultivation and its geographic distribution. However, as the data on cotton farming and trade (import/export) originates from different sources, we acknowledge the limitations of directly correlating cultivation sites with trade flows. Therefore, it is essential to avoid drawing inaccurate or misleading connections between the origin of cotton and its subsequent processing or export destinations.
Furthermore, in support of Target 12.8, which emphasises the importance of accessible, transparent sustainability information, we also aim to map the global distribution of H&M production facilities. This includes their spatial relationship with the company’s retail and sales operations in different countries. As the data sources vary, it is not possible to directly link the two maps. To get the big picture of H&M supply chain, we decided to keep all the 4 different maps.
🗺️ How Our Maps Are Structured
To clearly communicate the complexity of global textile production and consumption, we created four separate interactive maps, each focusing on a specific stage in the supply chain:
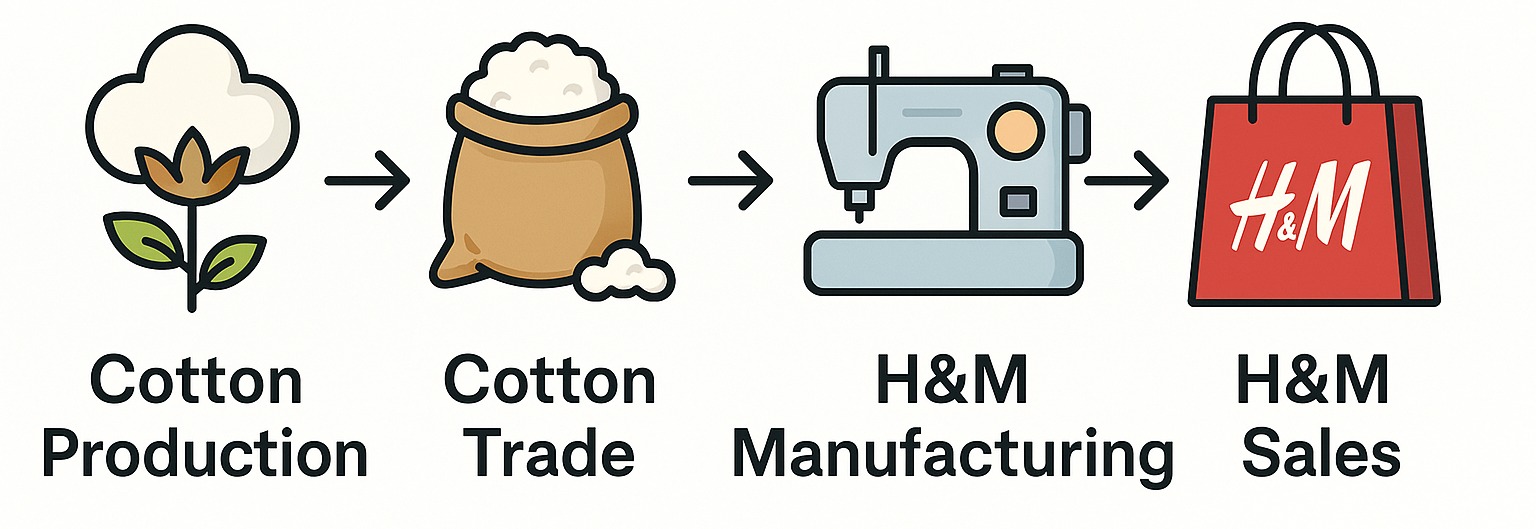
This linear structure reflects the journey from the fields to the final purchase. However, to avoid misleading conclusions, we chose to separate the maps. This is because:
- Not all traded cotton is Better Cotton.
- Not all H&M products that are manufactured and sold are made of cotton, other fabrics are used too.
By dividing the information into distinct maps, we ensure a clear, transparent, and truthful representation of each supply chain stage.
Cotton
Better Cotton Production Countries
This interactive map displays the countries where Better Cotton is grown. By clicking on each country, you can explore key information such as the number of licensed farmers, the total area of cotton harvested (in hectares), and the absolute volume of Better Cotton produced (in tonnes).
While most countries provide complete data, there are a few, namely Spain and Uzbekistan, for which details on harvested area, licensed farmers, and production volume are not available. These countries are still part of the Better Cotton network, but data transparency varies.
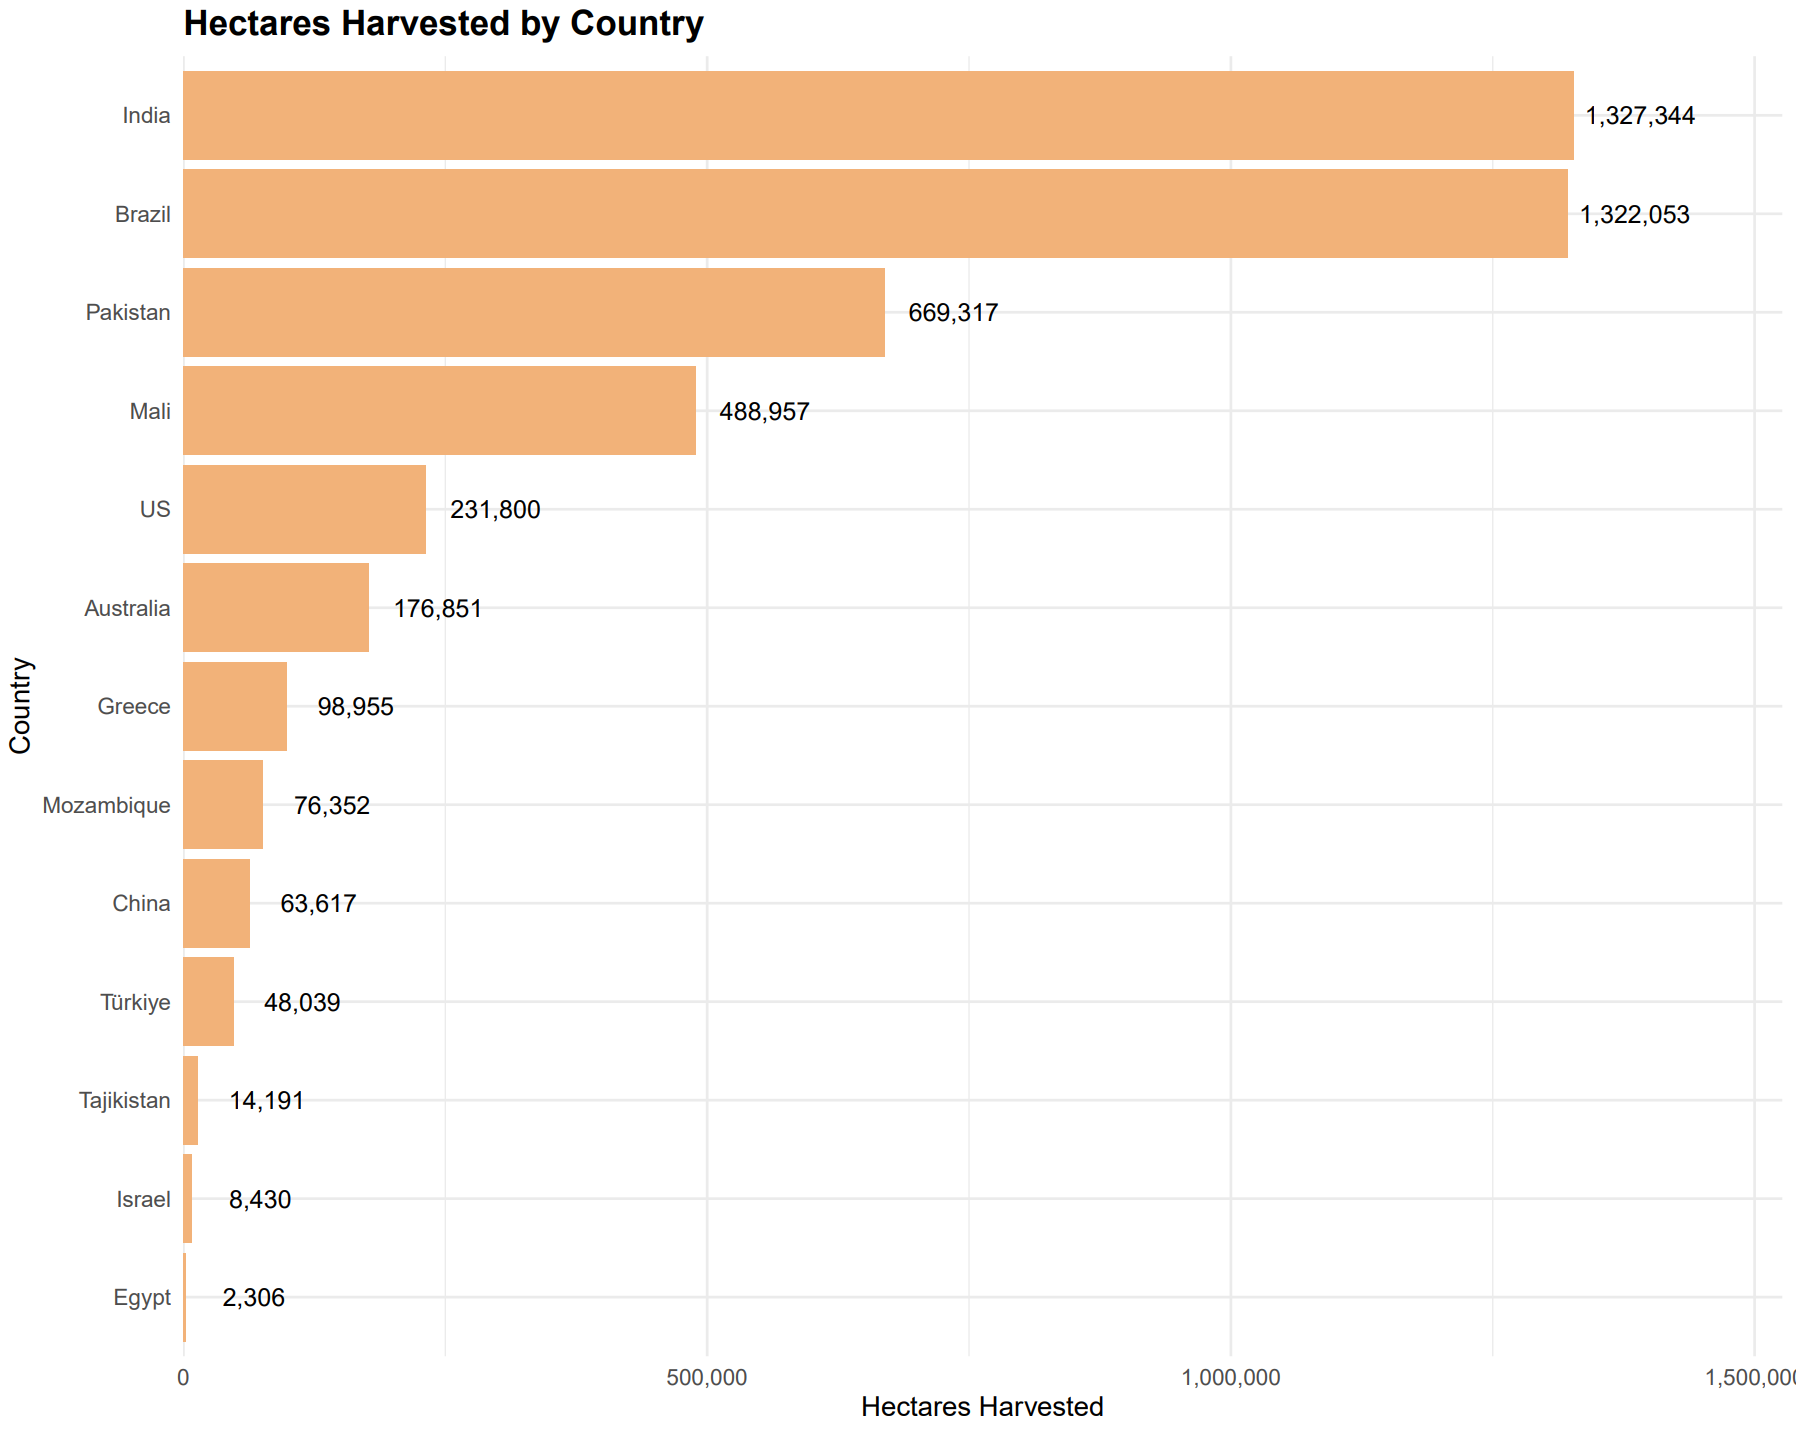
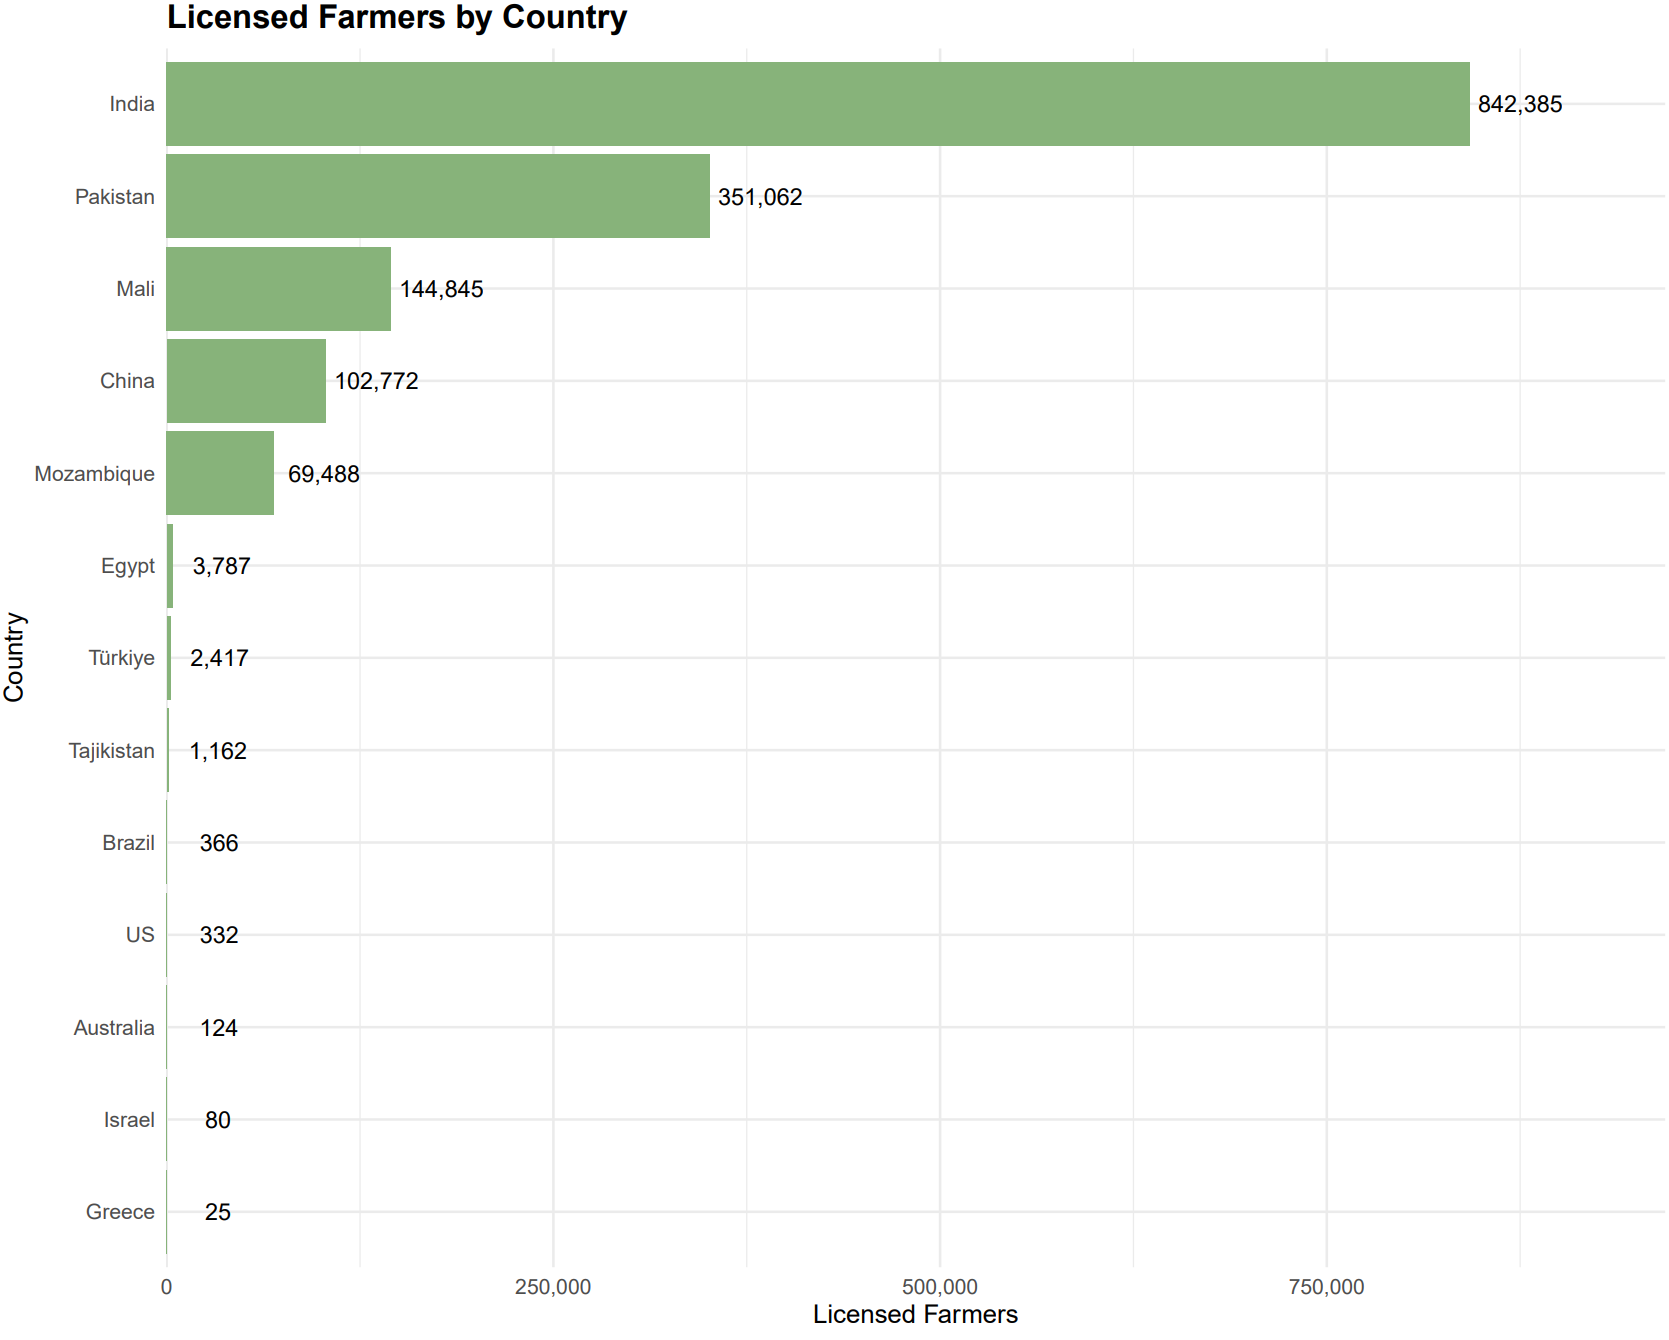
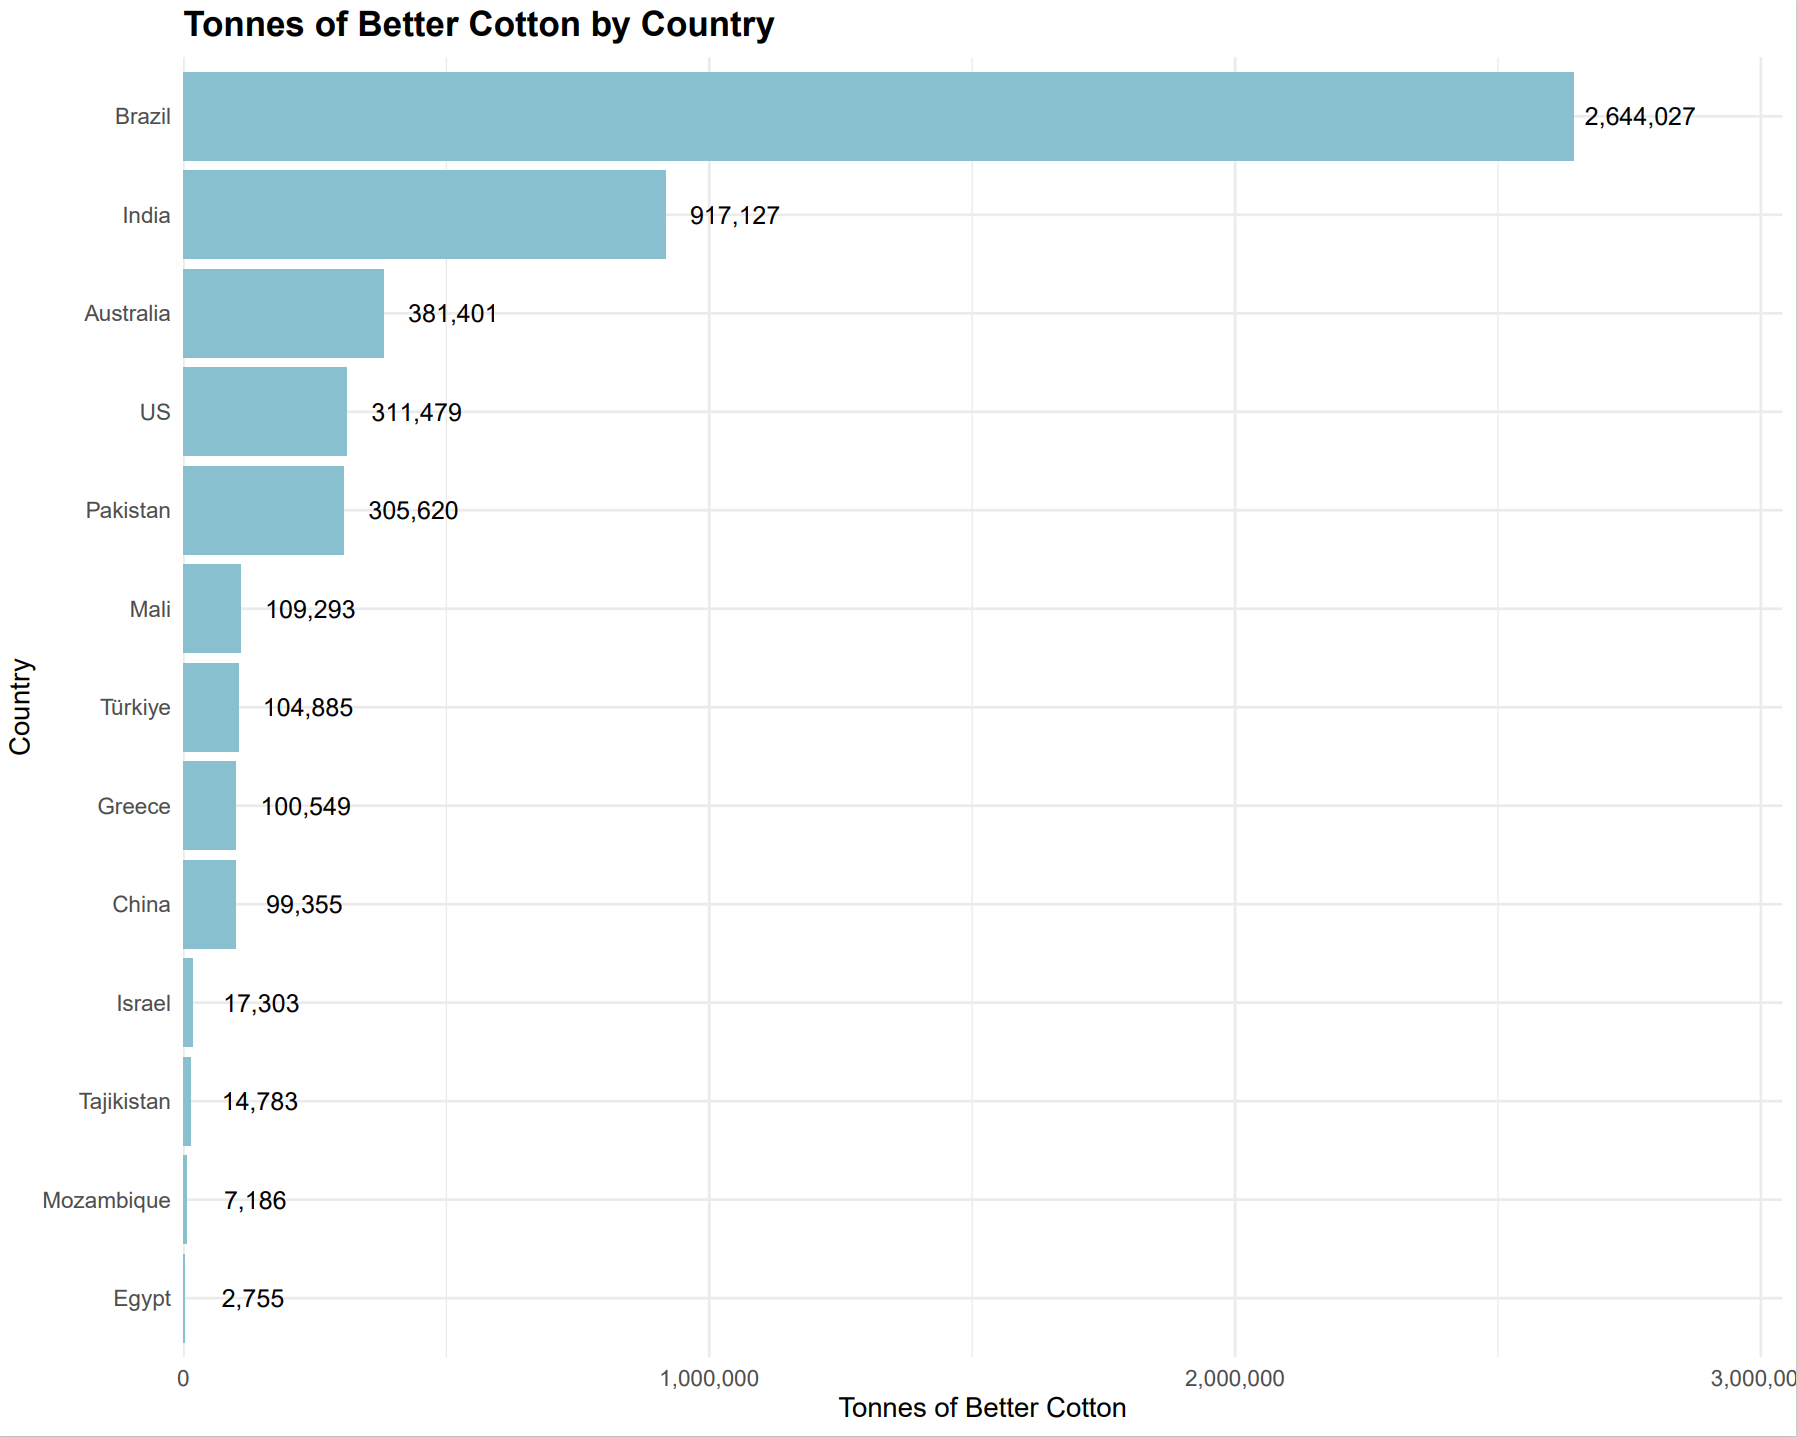
Below the map, you can explore our statistical visualizations of the Better Cotton data. Use the selection menu to choose between three charts: Hectares Harvested, Licensed Farmers, and Tonnes of Better Cotton. Each bar chart compares values across countries to highlight key differences in scale and participation. These visualizations are designed to complement the map and provide a more detailed look at cotton production patterns globally.
Select Statistic
- Hectares Harvested
- Licensed Farmers
- Tonnes of Better Cotton
Cotton Trade: Global Cotton Trade Flows
This interactive map visualizes global cotton trade flows over the years. You can select a year from the dropdown menu or use the play button to animate the trade data through time. Clicking on a country will highlight its export and import relationships, showing the total trade value and flow lines to partner countries.
H&M
Production: H&M Factories Worldwide
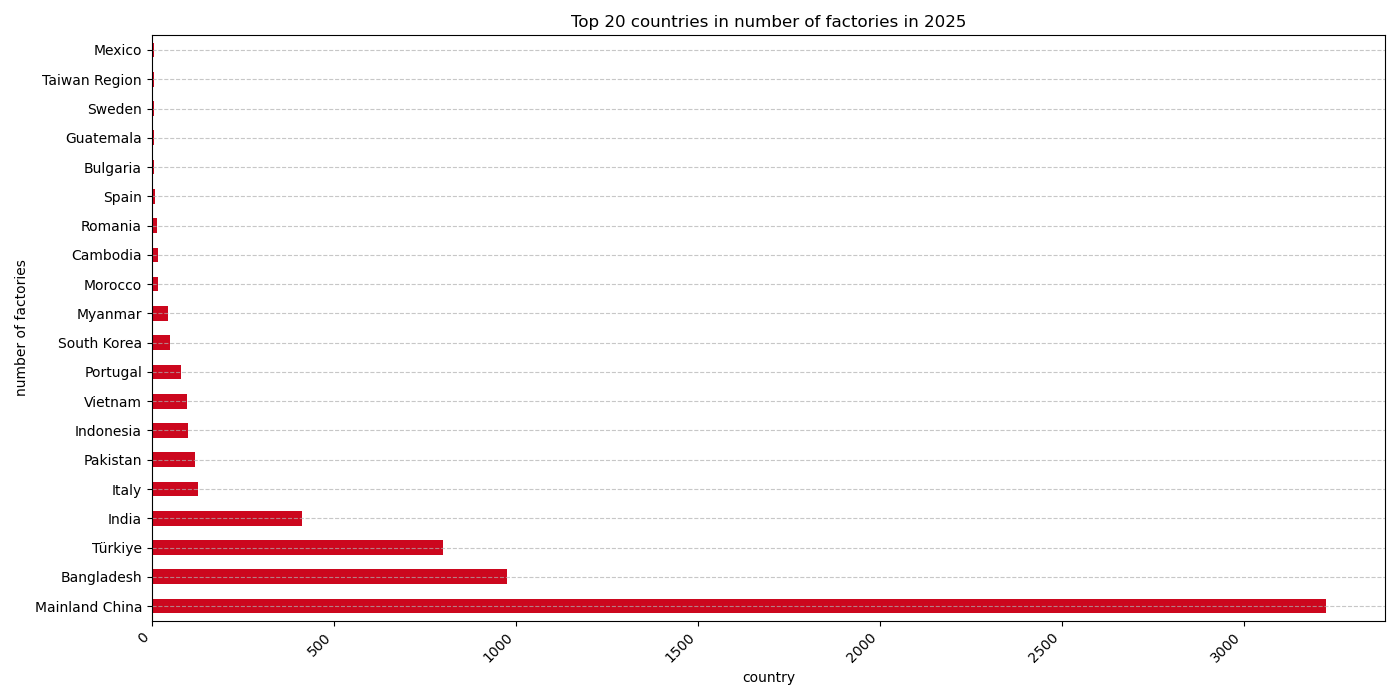
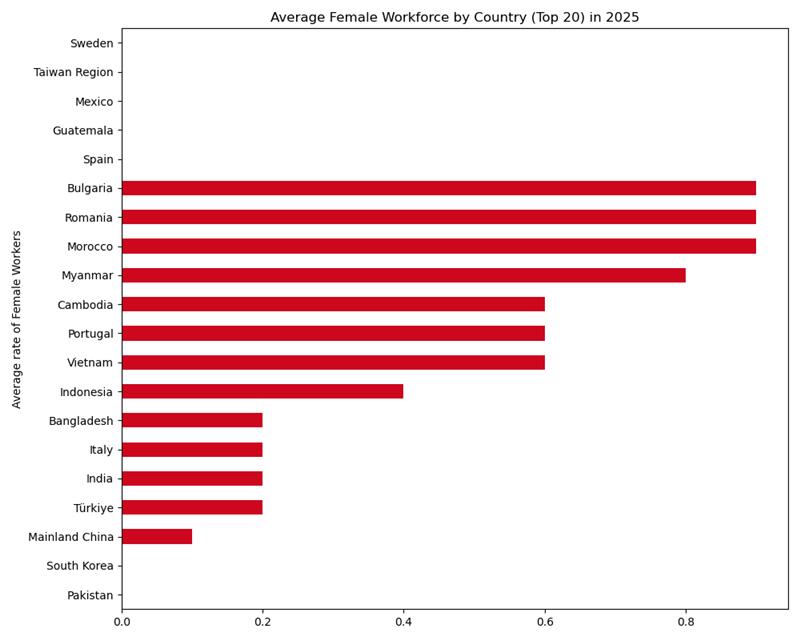
To get a better understanding where H&M produces and processes their clothing and accessories, you can look at the interactive map below. When you want to know more about the location, you can click on the dot for more information, like the size of the factory based on employees.
Select Statistic
- Number of factories
- Female Workforce
Sales: Global Sales by Country
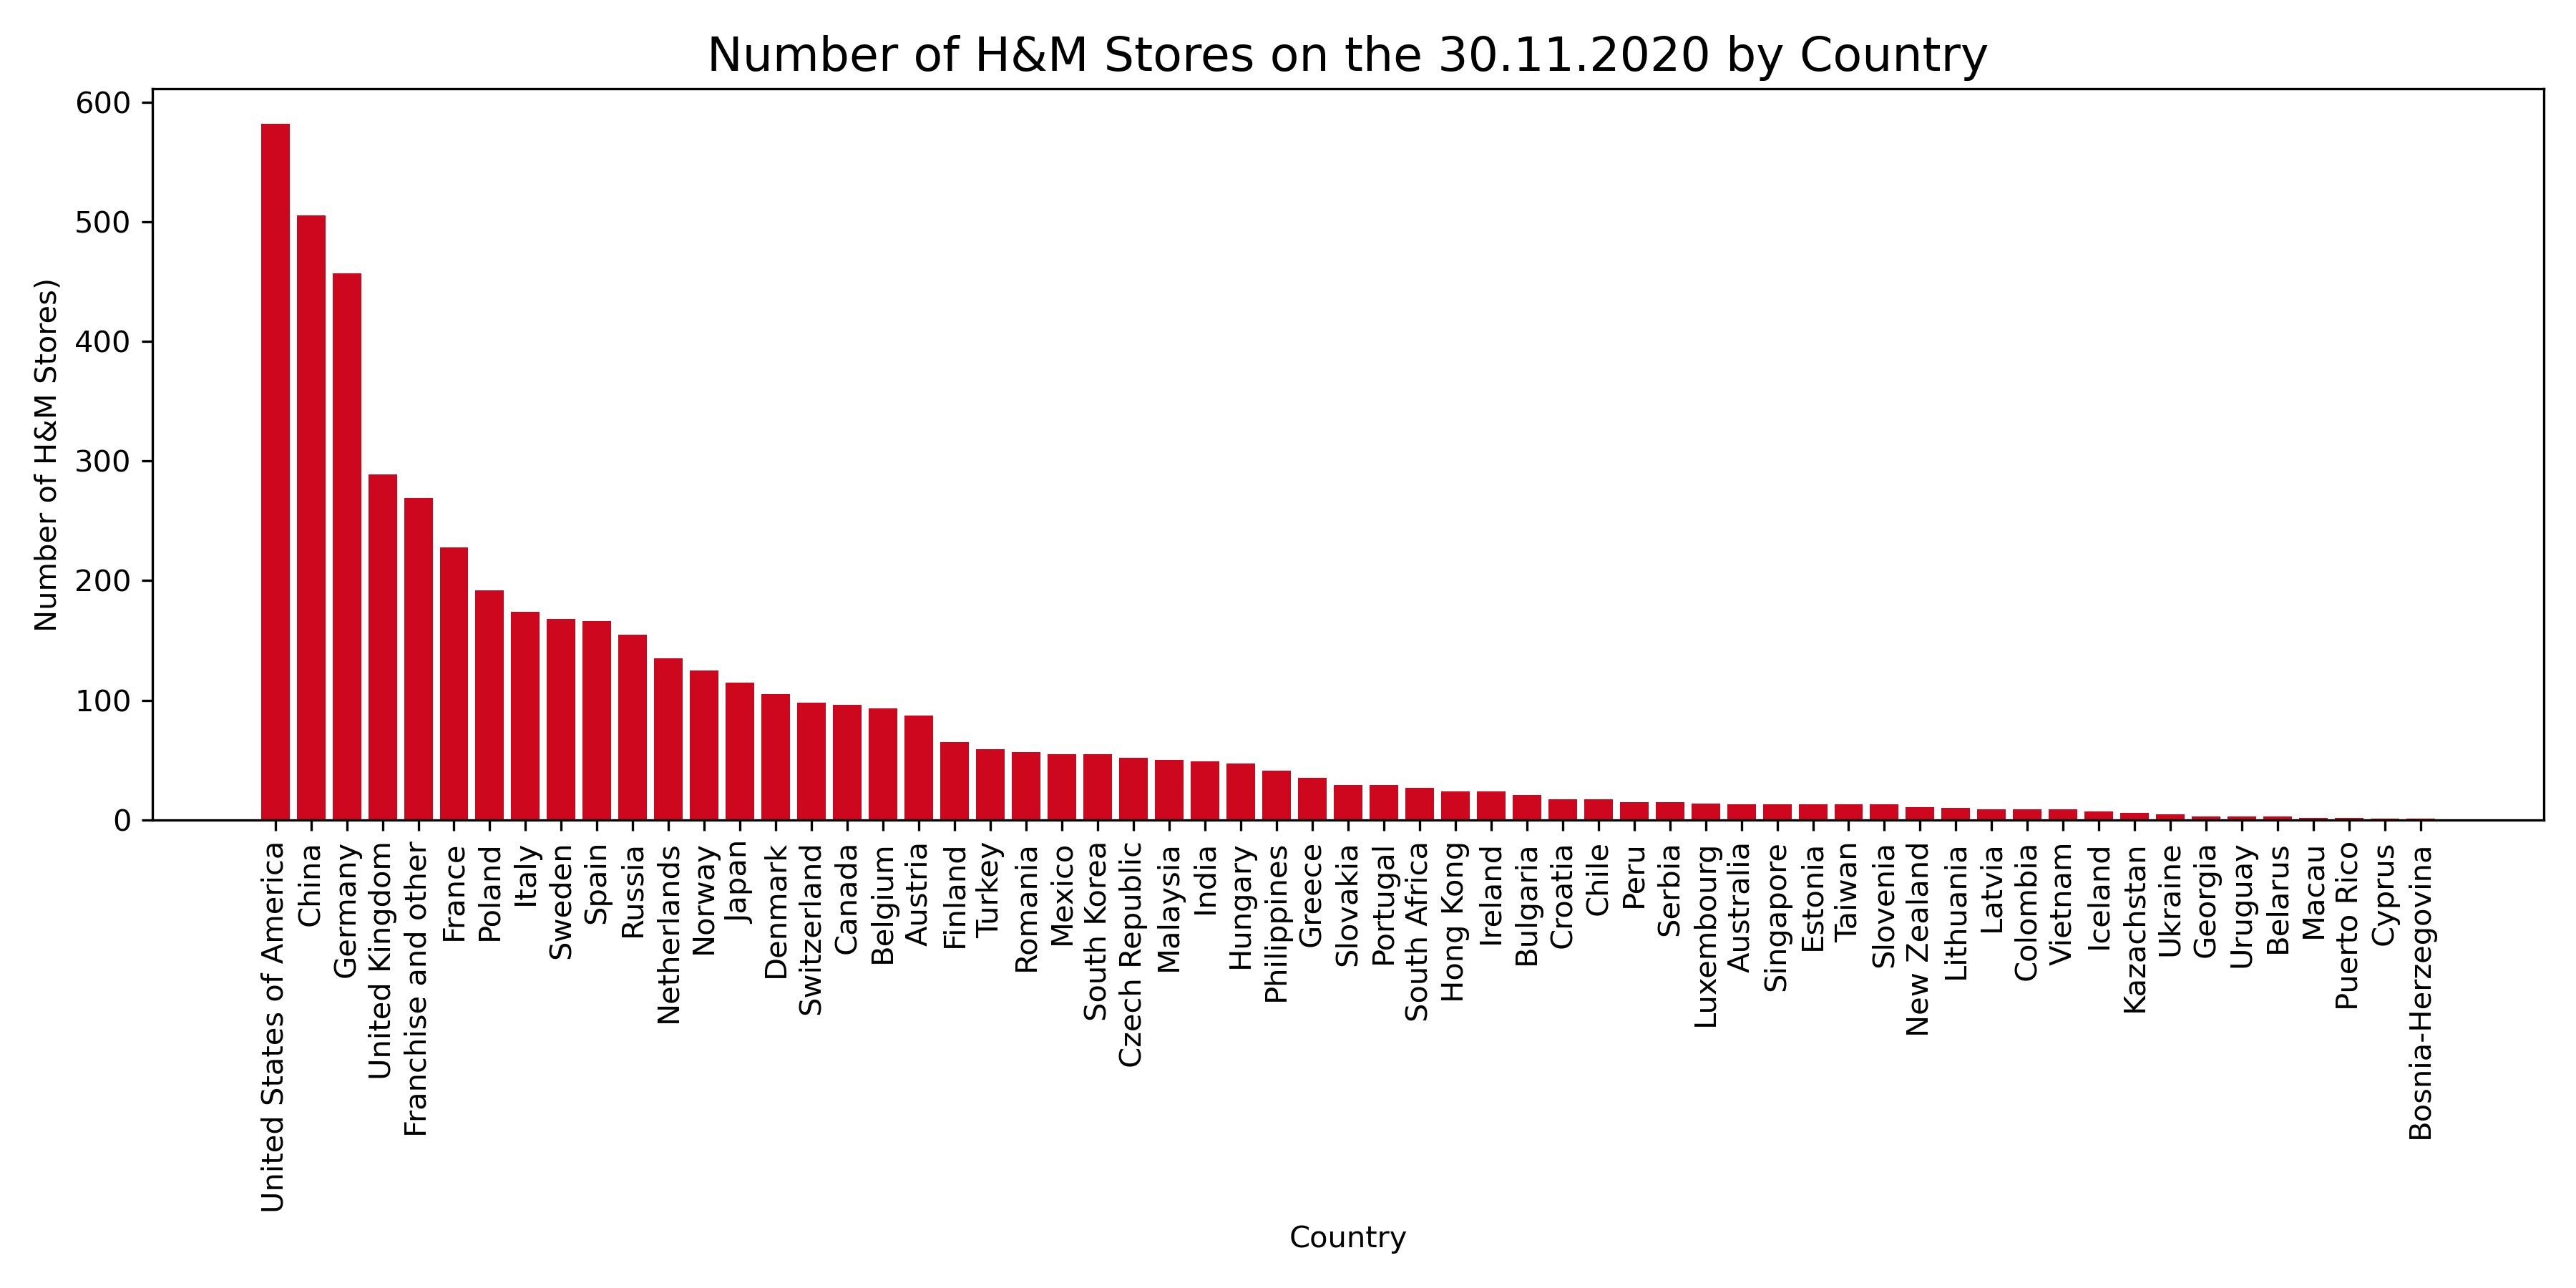
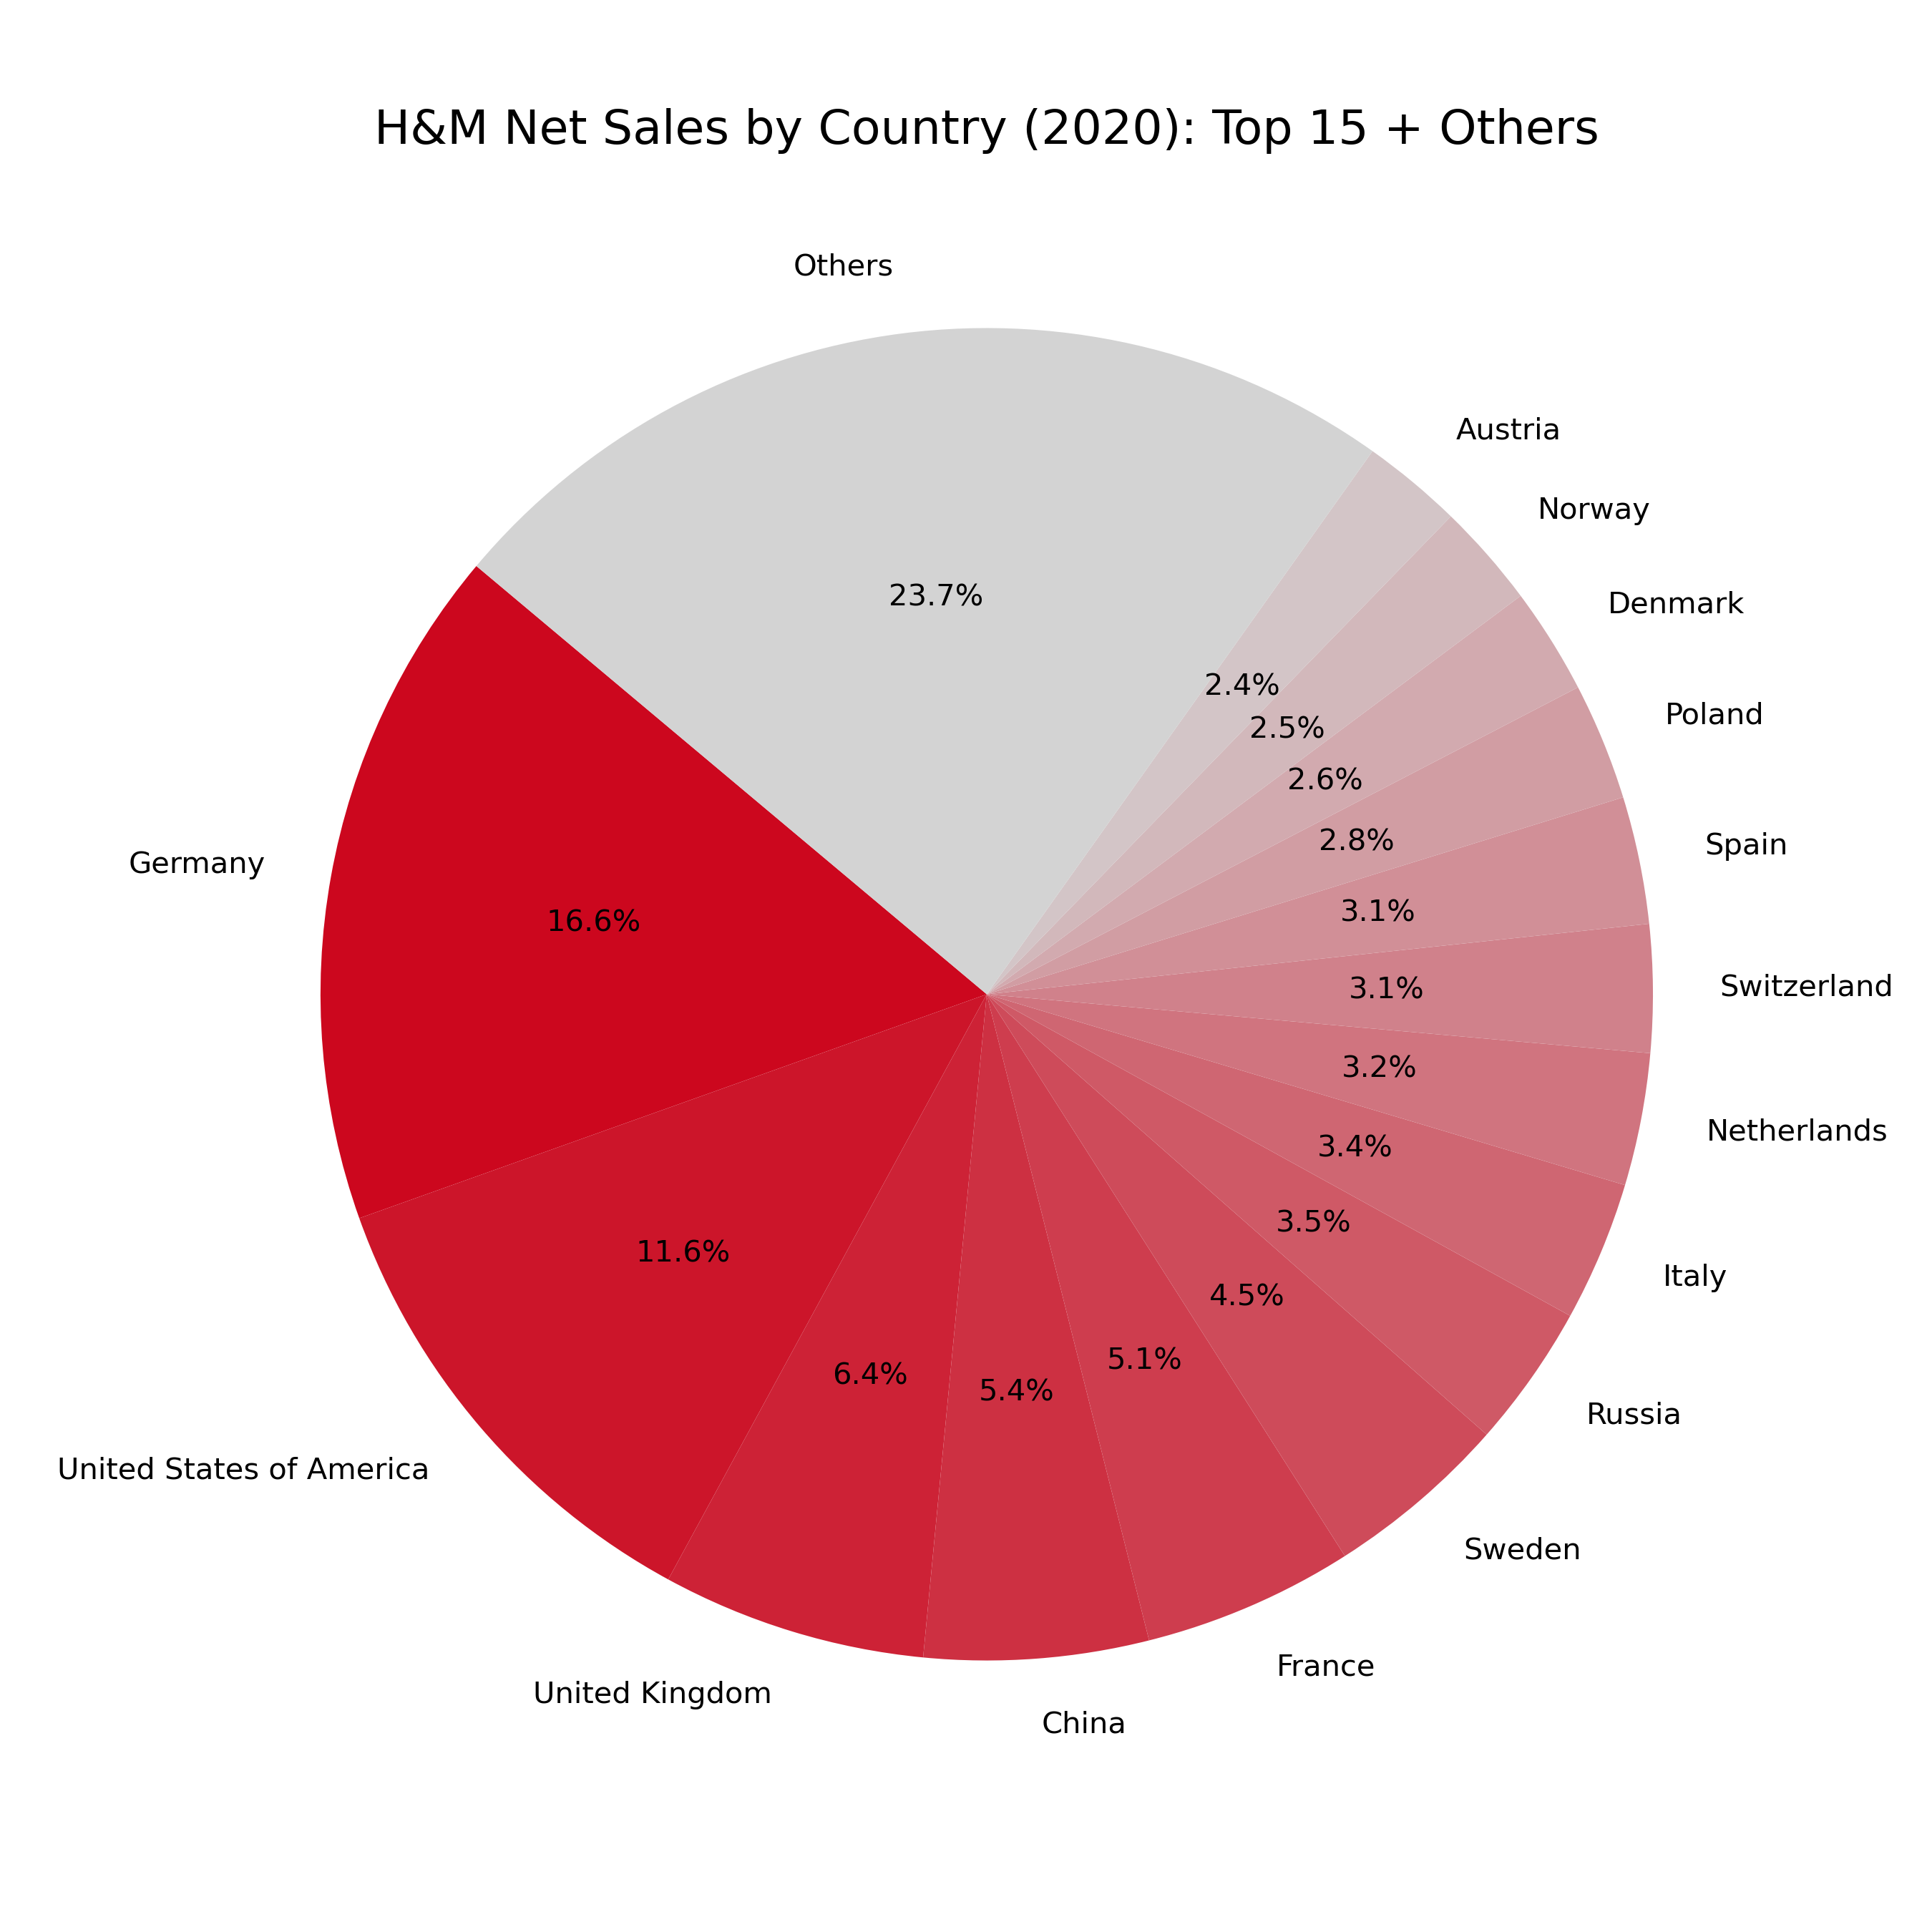
There are two interactive maps that show the countries where H&M sells their products and how much money they make by doing so. You can toggle between the maps on the top right, if the box next to the title is ticked, the map is visible. Clicking on each country will show you some key information about the availability of online sales, the total net sales in 2020 ($) and per store, the number of H&M stores in each country on the 30.11.2020 and how many stores the country gained or lost in the last year (2020).
Additional statistical information about how many H&M stores per country there are and how much each country contributes to global sales can be found below.
Select Statistic
- H&M Stores per Country
- Percentage of Global H&M Sales by Country
Findings
Our study utilised thematic maps and scholarly research to explore the sustainability of consumption and production patterns within H&M's cotton supply chain in alignment with SDG 12. The analysis addressed three sub-questions, each linked to a specific SDG 12 target.
1. Cotton Sourcing and Regional Challenges (Target 12.2)
H&M sources its cotton from a range of countries, including India, China, Pakistan, Brazil, and the United States (Sustainable Fashion Academy, 2021). While the company reports a high share of sustainably sourced cotton (e.g., Better Cotton, organic, or recycled), the effectiveness of such certifications is debated. Boström and Micheletti (2016) posit that the Better Cotton Initiative (BCI) frequently exhibits deficiencies in robust monitoring, potentially enabling the continued utilisation of pesticides and ambiguous labour practices.
In India and Central Asia, environmental concerns such as groundwater depletion and pesticide overuse are prominent (Islam et al., 2021). Furthermore, cotton production in regions such as Xinjiang, China, has been subject to allegations of forced labour, raising concerns regarding social sustainability (BBC, 2020; LeBaron, 2021). Our thematic map of cotton-growing regions highlights a geographic overlap between high cotton production and socio-environmental risks, reinforcing the need for more robust traceability mechanisms.
The processing of cotton, including spinning, dyeing, and garment manufacturing, is primarily concentrated in Bangladesh, Vietnam, Cambodia, and China. As Niinimäki et al. (2020) point out, there are significant disparities in environmental regulation and labour rights enforcement in these countries. Although H&M's supplier code of conduct outlines minimum standards, academic assessments suggest these are inconsistently enforced (Shen, 2014).
The environmental management of chemicals continues to present a significant challenge in the context of textile processing. For instance, dyeing facilities in Dhaka have contributed to substantial river pollution due to inadequate wastewater treatment (Kant, 2012). In Pakistan, the issue of hazardous chemical exposure among textile workers remains a concern due to the absence of robust occupational health policies (Ashraf & Merli, 2021). The thematic map of processing locations overlays national regulatory performance indexes and pollution data to visualise these disparities.
H&M is committed to promoting sustainable consumption through its "Conscious Collection," take-back schemes, and informational campaigns in stores and online. However, the effectiveness of these initiatives is contested. Kim and Hall (2020) observe that sustainability claims are often too generic and fail to provide concrete, product-level environmental data. Tunn et al. (2019) similarly argue that while H&M attempts to raise awareness, the communication is not always accessible or verifiable by consumers.
In addition, academic evaluations indicate that green marketing in the fast fashion sector can potentially mislead consumers when transparency is lacking and the environmental impact of product life cycles is not disclosed (Lundblad & Davies, 2016). Our thematic retail map illustrates the global distribution of H&M stores alongside production sites, revealing a disconnect between where garments are made and where sustainability messaging is delivered. This geographic and informational gap may hinder consumer empowerment and responsible consumption.
Methods
Why did we design the maps as they are?
The objective was to employ a basemap that would provide a minimal yet effective representation of our geographical location. As the initial scope of all maps is global, it is imperative to ensure the visibility of only those countries that are pertinent to the project, whilst simultaneously ensuring that all countries worldwide are sufficiently oriented. It was imperative that a uniform or at least highly analogous basemap be employed, given the divergent thematic emphases characteristic of each map. This was done in order to ensure that the map could be utilised as a design foundation. The basemap was selected in a grey tone to ensure minimal distraction for the primary layer. The background, which is light and soft, serves to provide a sufficient amount of space for the presentation of the results.
Map styles
We used a combination of dot density, flow, and choropleth maps to communicate different types of data effectively.
Dot Density Production Map:
For the production site map, we decided to use the colour of the H&M logo to establish a direct visual link to the subject matter.
The main goal was to show where the factories are located and provide an overview of the areas with the highest production factory density, so we produced a dot density map.
Additionally, as the map starts on a global scale, it is important to cluster and zoom in on the information to make it more manageable.
Cotton Trade Flow Map:
The Cotton Trade Flow Map visualizes the global trade in cotton. The aim was to show the trade flows between the different nations with the help of lines and circle symbols.
When selecting a nation, the map is colored so that a distinction can be made between exports and imports. In addition, comparisons can be made between the individual years.
Choropleth Maps – Better Cotton & H&M Sales:
We used choropleth maps to show where Better Cotton is produced and where H&M products are sold around the world.
By shading countries based on production or sales levels, the maps provide a quick and intuitive overview of global patterns.
To ensure fair comparisons, we normalized the Better Cotton map by country area, so large countries don't appear more active just because they have more land.
For the H&M sales map, we normalized sales figures by the number of factories per country, highlighting where demand is highest relative to production capacity.
Both maps are interactive, allowing users to click on a country and explore more detailed information such as the number of licensed Better Cotton farmers, hectares harvested, tonnes produced, or H&M product sales.
It’s an engaging way to better understand the global reach and impact of sustainable cotton production and consumption.
Data Sources
Image sources
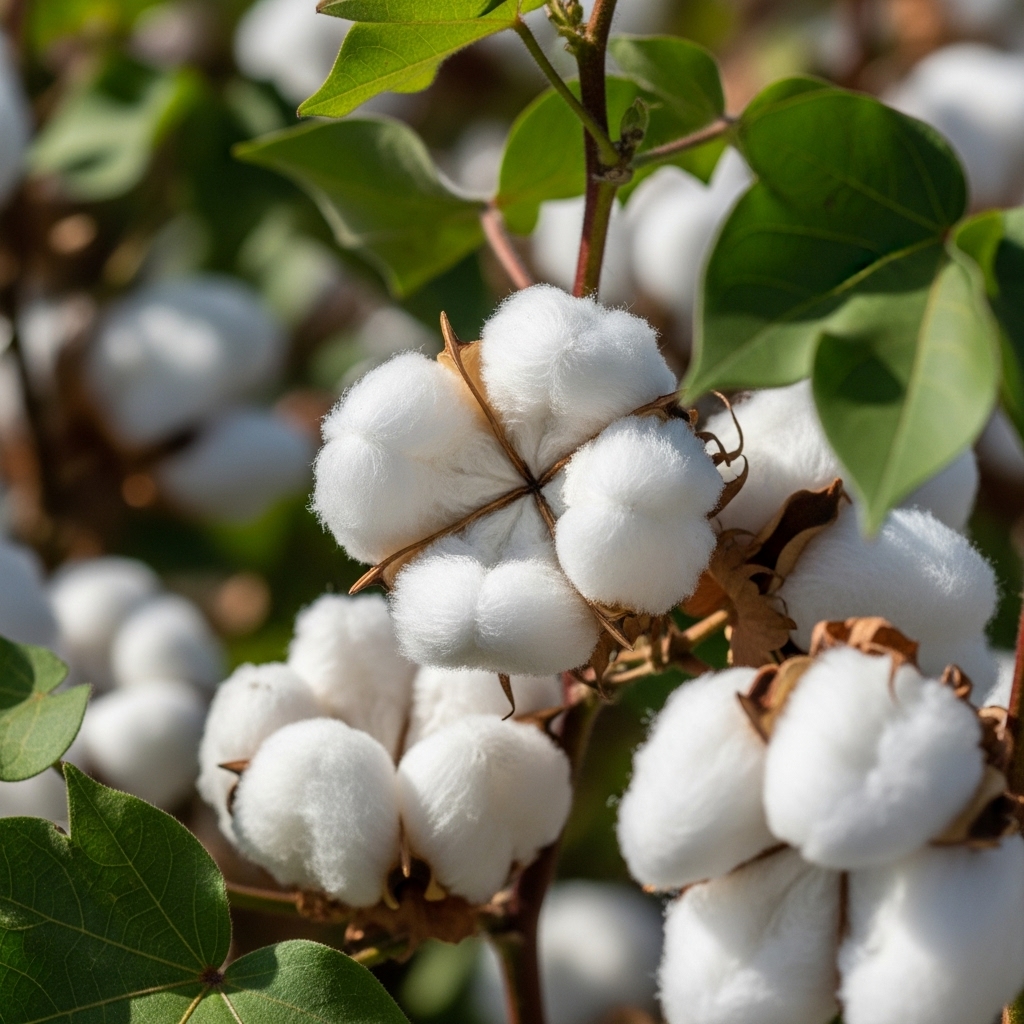
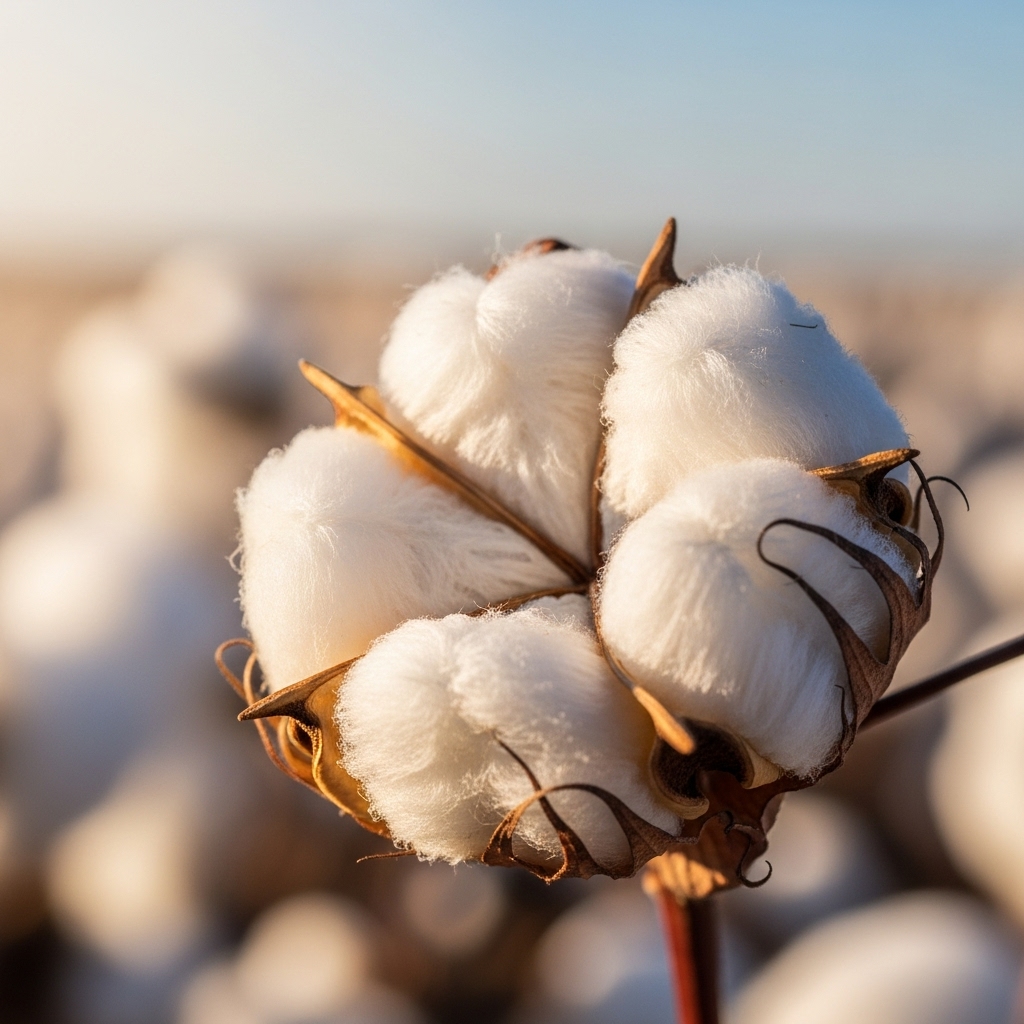
Cotton image
Resource Center.image (last accessed: 26.05.2025)
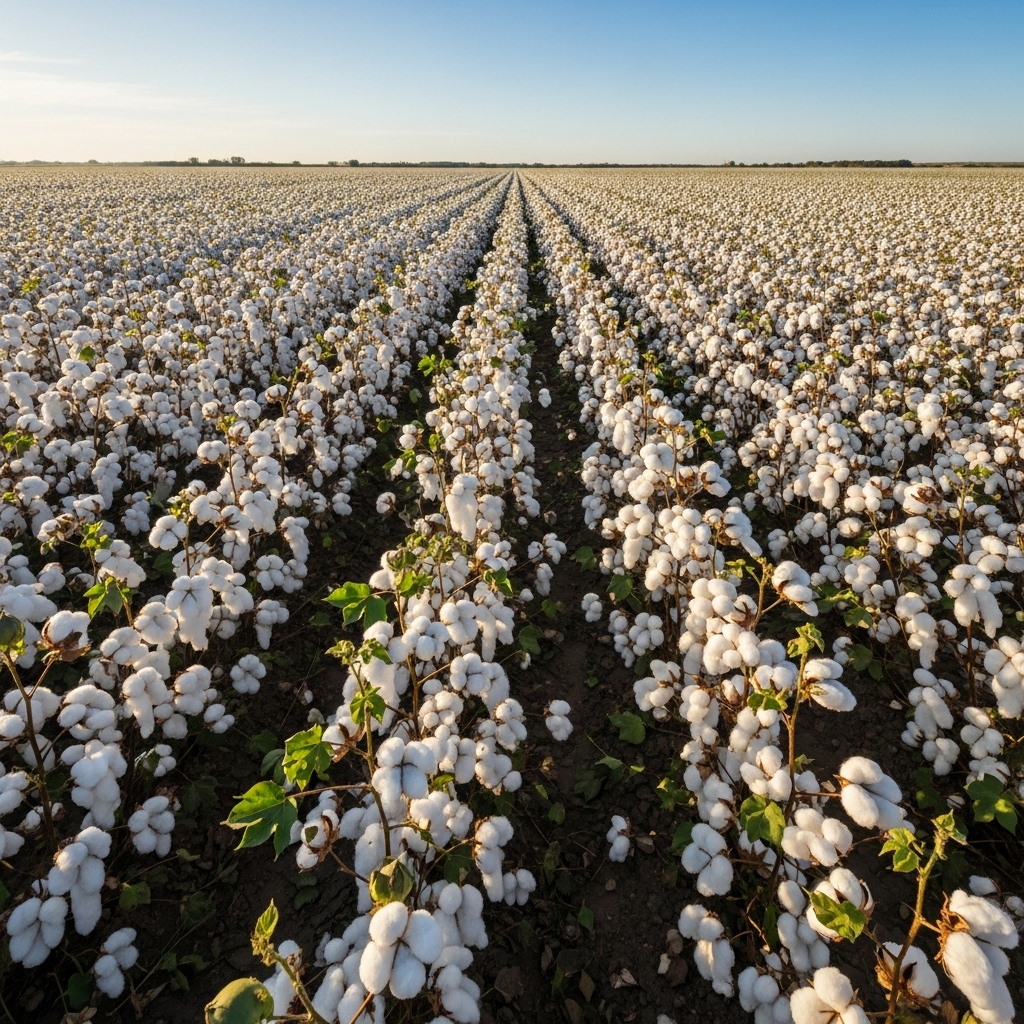
Production chain map
AI generated with ChatGPT (31.05.2025)
Information sources
H&M sustainability report
H&M Sustainability Report (last accessed: 26.05.2025)
Better Cotton website
Better Cotton (last accessed: 27.05.2025)
Cotton Trade Database
Cotton Trade Database (last accessed: 27.05.2025)
Additional Resources
Links to relevant studies and sources.
References
- Ashraf, M. A., & Merli, R. (2021). Sustainable practices in textile chemical management: Insights from Pakistan. Journal of Cleaner Production, 284, 124754.
- BBC. (2020). China’s forced labour: What’s happening in Xinjiang? [Online]
- Boström, M., & Micheletti, M. (2016). Introducing the Sustainability Challenge of Textiles and Clothing. Journal of Consumer Policy, 39(4), 367–375.
- Islam, G. M. T., Rahman, S., & Haque, M. A. (2021). Water and pesticide use in cotton production: A global overview. Sustainability, 13(6), 3245.
- Kant, R. (2012). Textile dyeing industry: An environmental hazard. Natural Science, 4(1), 22–26.
- Kim, H., & Hall, C. M. (2020). Green brand transparency in online fashion retail: A signaling theory perspective. Journal of Retailing and Consumer Services, 56, 102176.
- LeBaron, G. (2021). Combatting modern slavery in supply chains: A research agenda. Business & Human Rights Journal, 6(2), 205–227.
- Lundblad, L., & Davies, I. A. (2016). The values and motivations behind sustainable fashion consumption. Journal of Consumer Behaviour, 15(2), 149–162.
- Niinimäki, K., Peters, G. M., Dahlbo, H., Perry, P., Rissanen, T., & Gwilt, A. (2020). The environmental price of fast fashion. Nature Reviews Earth & Environment, 1(4), 189–200.
- Shen, B. (2014). Sustainable fashion supply chain: Lessons from H&M. Sustainability, 6(9), 6236–6249.
- Tunn, V. S. C., Bocken, N. M. P., van den Hende, E. A., & Schoormans, J. P. L. (2019). Business models for sustainable consumption in the circular economy. Journal of Cleaner Production, 212, 324–333.
- Turker, D., & Altuntas, C. (2014). Sustainable supply chain management in the fast fashion industry: An analysis of corporate reports. European Management Journal, 32(5), 837–849.
🤖 AI Statement
This website was developed with assistance from AI (ChatGPT), which supported the creation of HTML structure and content design.