Home
Hello everyone!
We are a team of four Geography students from the University of Zurich, and this website is part of our Master's module GEO454 Geovisualization, taught by Prof. Dr. Sara Fabrikant.
While exploring potential topics for our web map, we came across the ACLED website (see Data Sources
), which provides global conflict data. In Western education, the African continent is frequently underrepresented, which contributes to a general lack of awareness about past and current issues. To add to the conflict data, we are also looking at two further variables, namely military spending and democracy index in the region as we want to see the influence these two have on the conflicts.
To help shed light on an ongoing crisis, we decided to focus our map on the conflicts occurring in the Democratic Republic of the Congo, particularly in the eastern region, where the situation is especially critical today.
Research Questions
The research questions that we want to answer with our map is:
- Where and what kind of conflict has occured between 2008 and today in the Democratic Republic of Congo?
- Can we see a parallel between military spending, democracy index and number of conflicts?
Background
United Nations Sustainable Development Goals
The United Nations Sustainable Development Goals (SDGs) are a set of 17 global goals adopted by all UN member states in 2015 as part of the 2030 Agenda for Sustainable Development. They aim to address the world's most pressing challenges such as poverty, inequality, climate change, peace, and justice (United Nations, 2015).
Our topic is linked to goal number 16: Peace, Justice and Strong Institutions. This SDG promotes peaceful societies, access to justice, and effective institutions essential for sustainable development (United Nations, n.d.).
Conflicts in Congo: historical
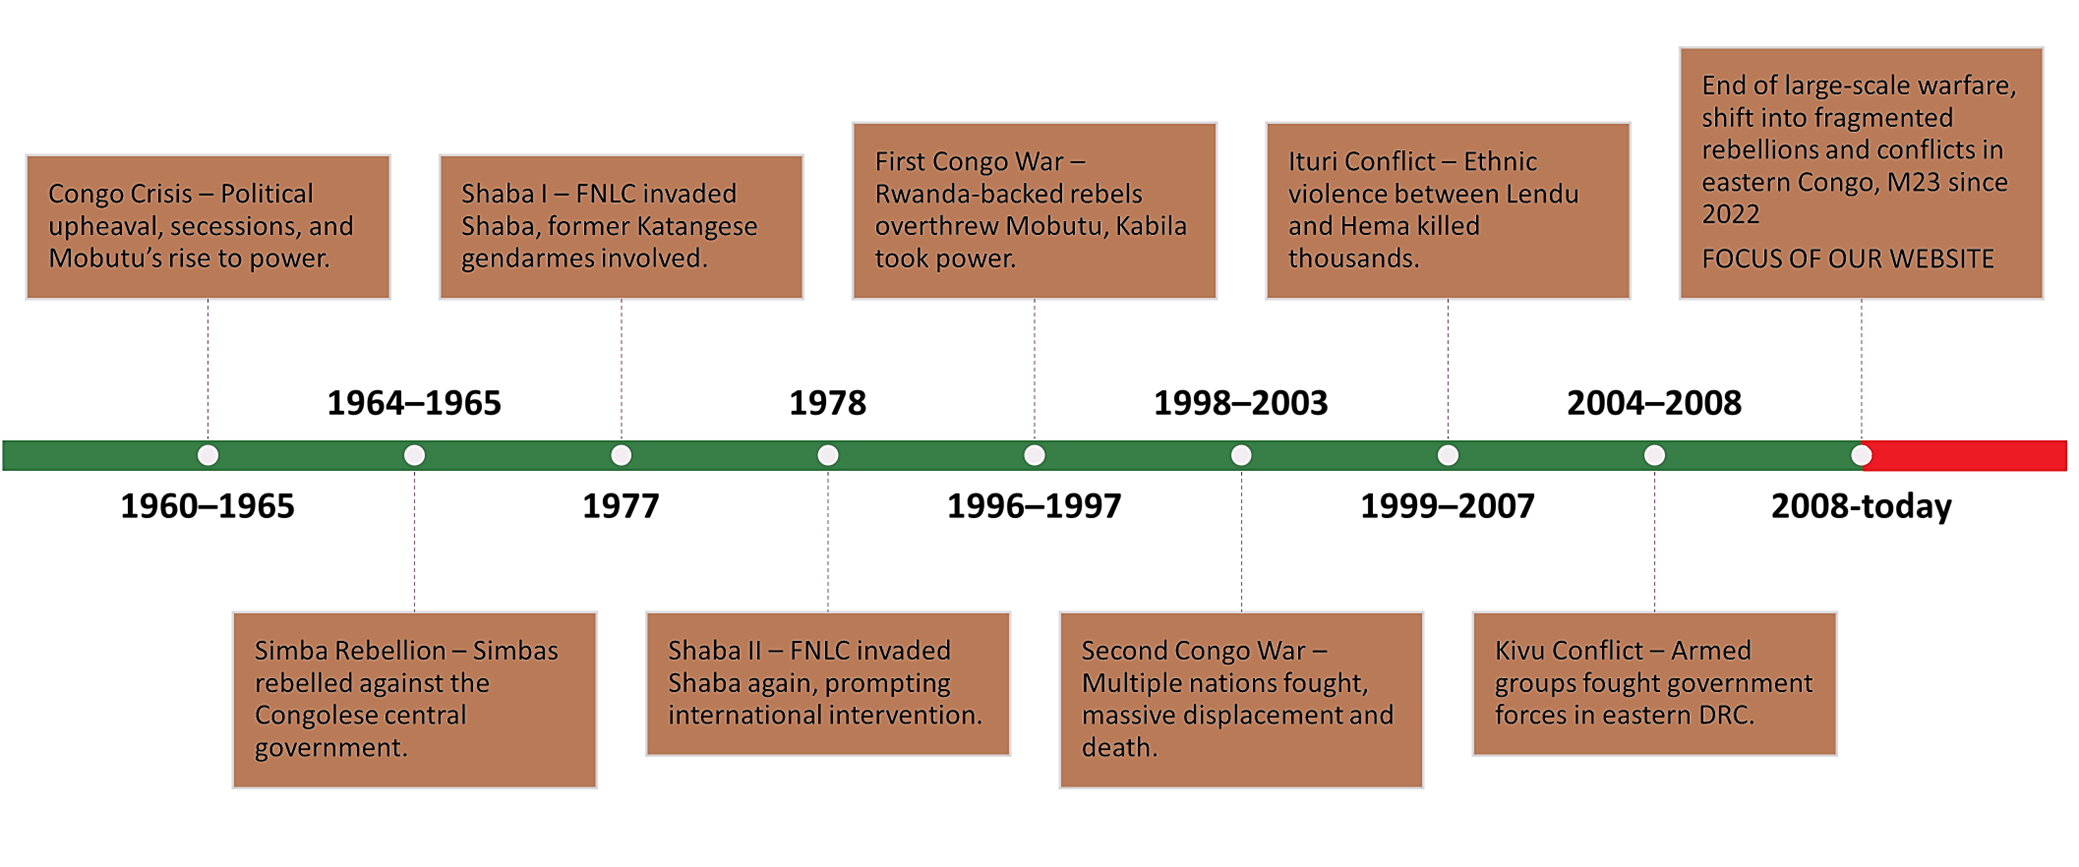
Since gaining independence from Belgium in 1960, the Democratic Republic of the Congo (DRC) has faced ongoing conflict and political instability. In 1965, Mobutu Sese Seko seized control and ruled for over three decades, during which corruption and repression deepened national tensions.
Following Mobutu's fall in 1997, the DRC became the center of the First and Second Congo Wars (1996-2003), involving several neighboring countries and armed groups. Since 1996, different conflicts in eastern DR Congo have resulted in ~6 million deaths (Global Conflict Tracker, 2024). Though a peace deal ended the large civil wars, violent clashes have continued, particularly in the eastern regions, driven by competition over natural resources, ethnic tensions, and the presence of rebel militias. These conflicts have led to severe humanitarian crises, with millions affected by displacement, insecurity, and human rights abuses (Amnesty International, 2024; Center for Preventive Action, 2025).
Conflicts in Congo: recent years
The current conflict in eastern Democratic Republic of the Congo (DRC) is heavily centered around the rebel group known as M23 (March 23 Movement). Originally formed in 2012 by former members of the Congolese army, M23 claimed the government had failed to uphold a peace agreement. They briefly seized parts of eastern DRC, including Goma, before being defeated in 2013 and going into exile.
However, the group resurfaced in 2021, and their attacks have intensified since then, especially in 2024 and 2025, leading to a major humanitarian crisis. M23 is widely believed to be supported by Rwanda, a claim Rwanda denies, but which has been echoed by UN experts. This has fueled tensions between the DRC and Rwanda, particularly over control of mineral-rich territories in the east.
M23 says it is fighting for the rights of Congolese Tutsis, but its actions such as attacks on civilians, displacement of communities, and seizures of territory have deepened instability in the region. Despite ongoing peace talks, the group remains active, and the situation on the ground continues to worsen (Center for Preventive Action, 2025; Huon, 2025).
Findings
Eastern DRC shares borders with Uganda, Rwanda, and Burundi, and the region has long been destabilized by cross-border rebel movements and foreign military operations. Armed groups, such as the ADF (Allied Democratic Forces) and M23, have roots or support from neighboring countries. Regional powers often back proxy militias for strategic and economic interests, blurring the line between internal conflict and international meddling.
The March 23 Movement (M23) is the most prominent rebel group to emerge from the fallout of the two Congo Wars, coming to the front of the conflict in Eastern Democratic Republic of Congo in late 2000s. Since 2012, M23 has operated in the province of North Kivu, engaging in frequent exchanges with the Congolese Army, at varying intensities. Their activities are suspected to be funded at least partially by the Government of Rwanda. M23's activities have reached new highs in the period between 2020 and 2024.
The Allied Democratic Forces (ADF) is an Islamist militant group originally formed in Uganda in the 1990s. It was founded as an anti-government rebel group opposed to President Yoweri Museveni but was pushed out of Uganda and has since operated primarily in the eastern Democratic Republic of Congo (DRC), especially in North Kivu and Ituri provinces.
Intensity and type of unrest and fighting for the period between 2008 and the present can be summarized in multiple ways. We divide our analysis of the event data into following lenses: event frequency, event types, fatalities, and location.
Event types
The bulk of the intensification increase observed after 2017 is due to a sharp increase in battle events and events classified as violence against civilians. Battles peaked in 2021, with a reported total of 1,486 events. In the same year, violence against civilians also peaked, with a reported total of 1,409 events. Between 2018 and 2019, the number of protest events sharply increased, and remained steadily high through the deescalation of violence in 2023, but it has not dropped to pre-2019 levels. Riots, too, follow a similar pattern, peaking in 2021, but never reaching the same, high, reported event quantities. Strategic developments (typically state-led actions) began increasing in 2017, accelerating in 2020, and peaking in 2023 with a total of 658 reported events.
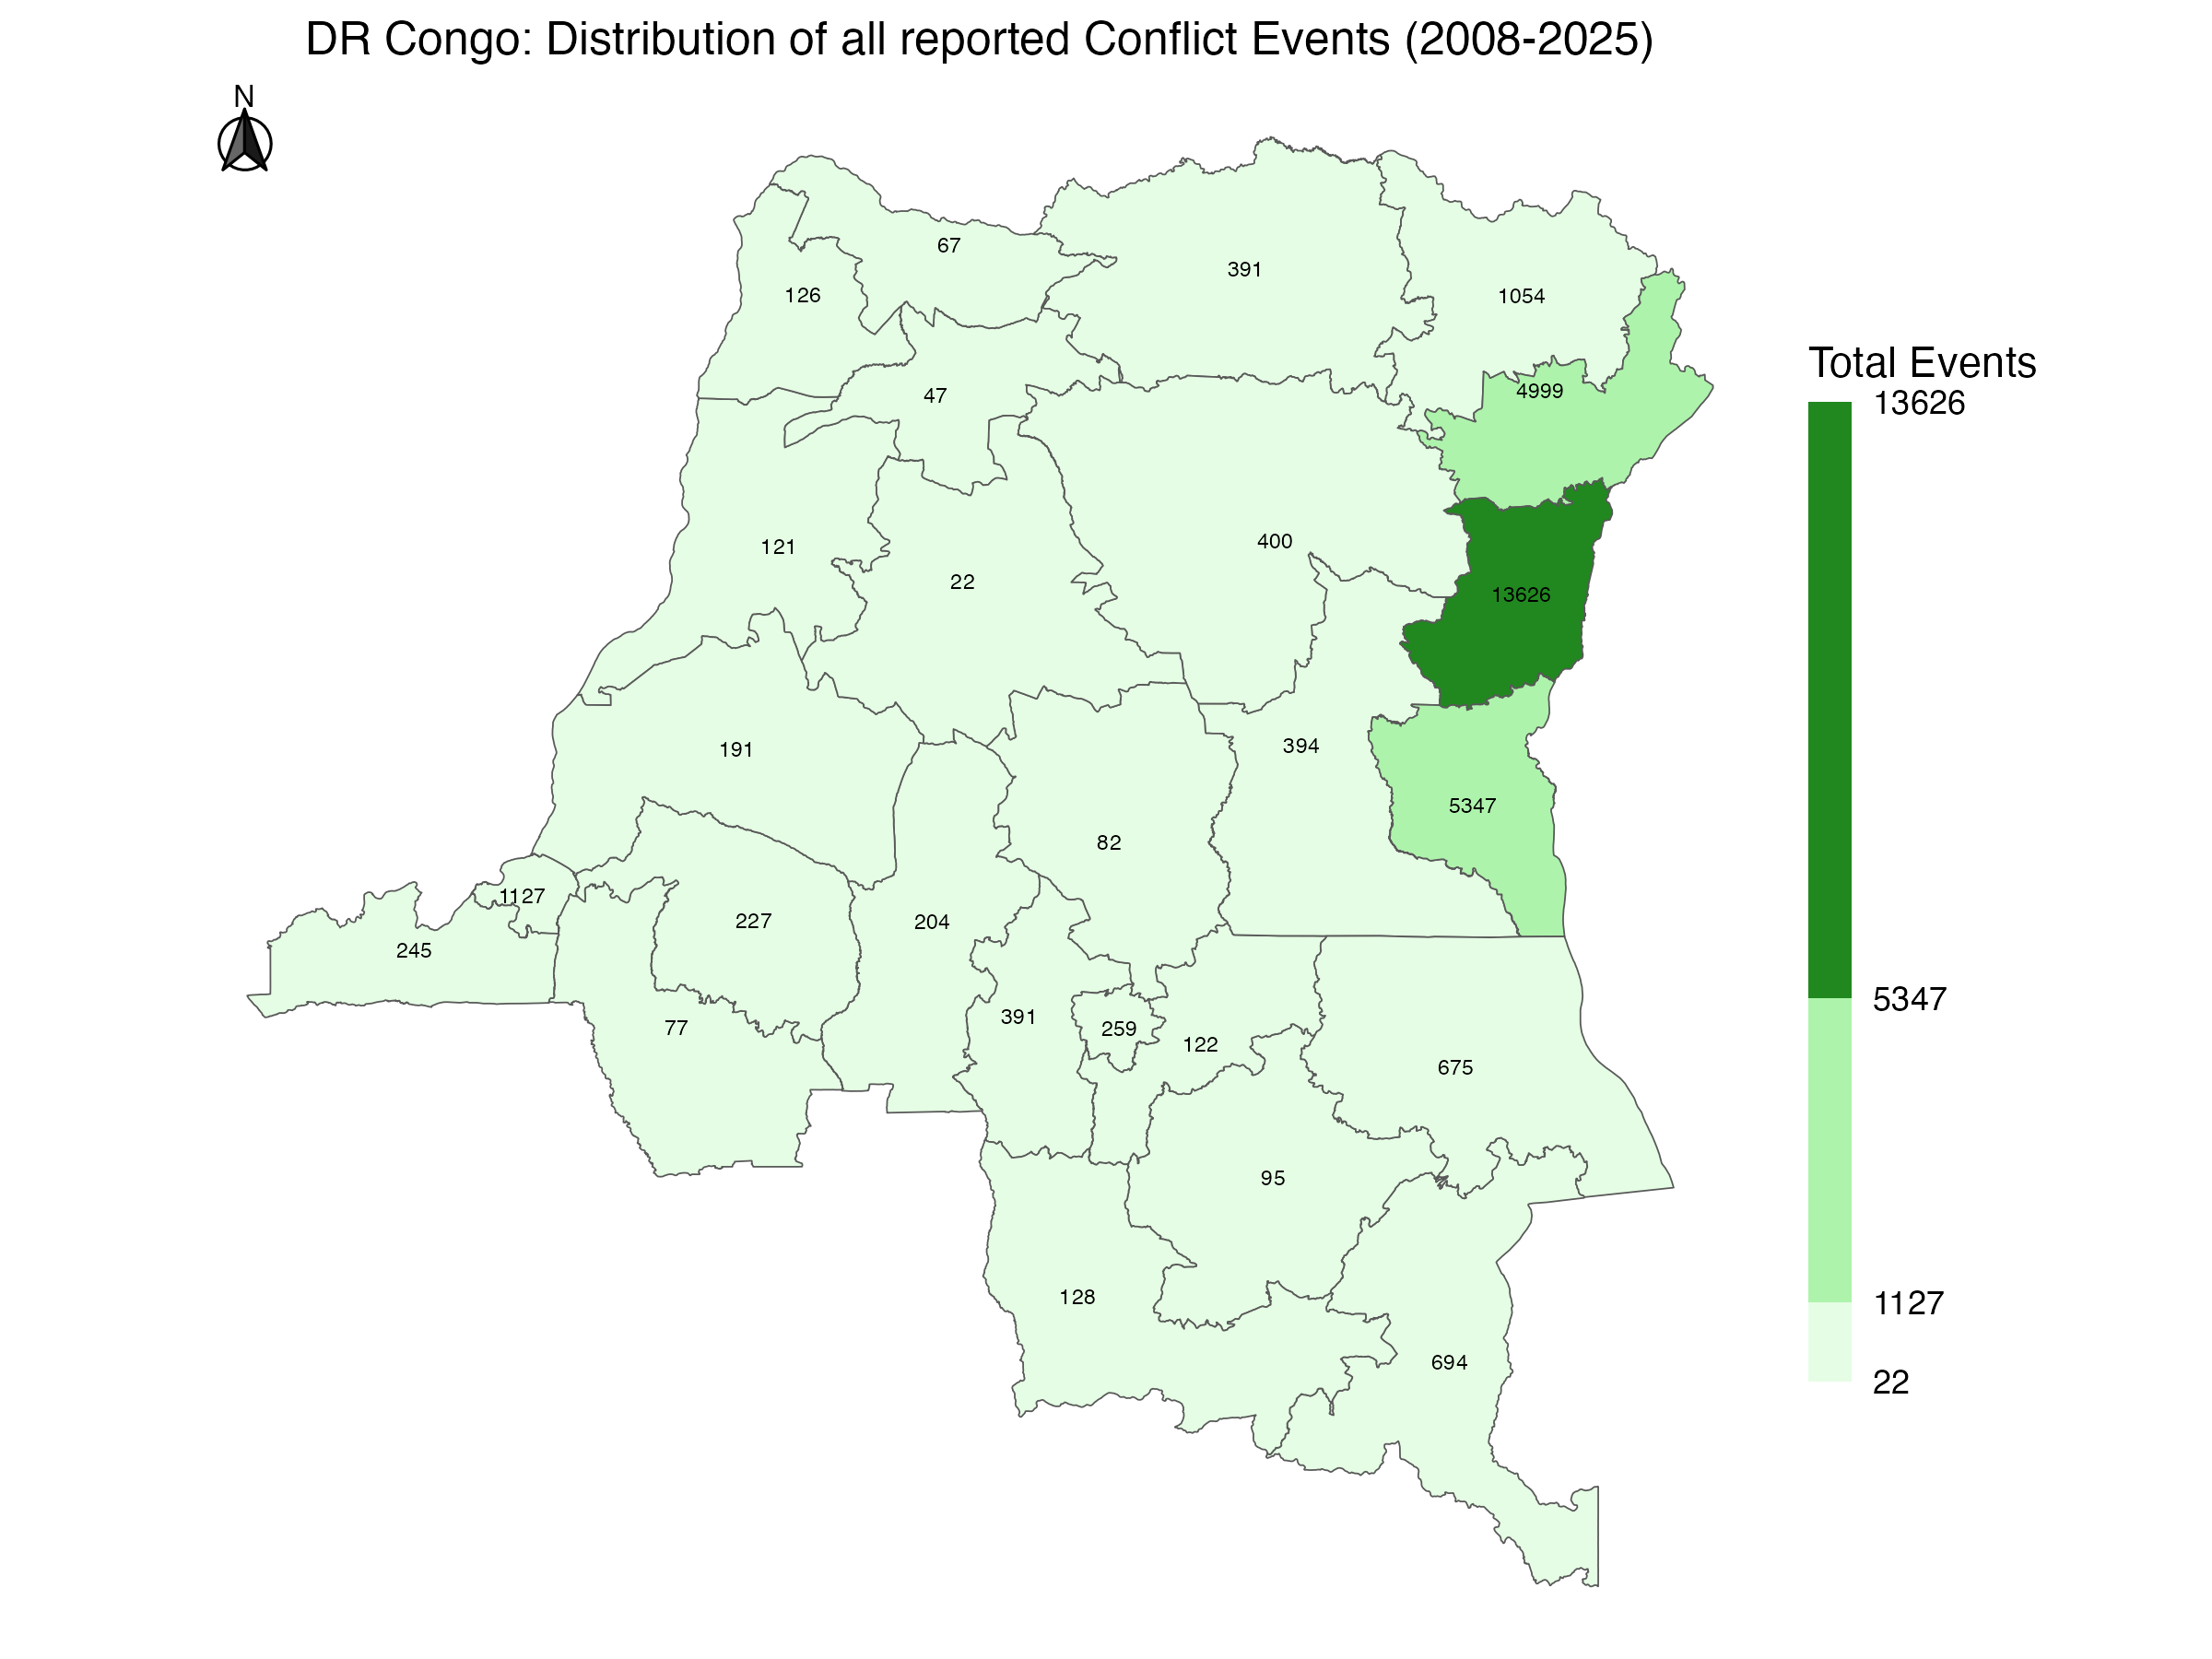
Between 2008 and 2025, conflict related events in the Democratic Republic of Congo have been most heavily concentrated in the eastern provinces, with Nord-Kivu again leading with 13,626 recorded events. Ituri (4,999) and Sud-Kivu (5,347) also experienced high event volumes, indicating persistent unrest. Central provinces like Kinshasa and Maniema had moderate activity, while western provinces such as Mai-Ndombe, Kwango, and Tshuapa recorded relatively few events, often under 200. This spatial distribution underscores that armed conflict in the DRC has been largely concentrated in the east, with sporadic incidents elsewhere in the country.
Event frequency
Between 2008 and 2012, annually, the number of reported events was below 1,000. Since the mid-2010s, the Democratic Republic of Congo has experienced a notable increase in the frequency of conflict events, especially in the eastern provinces of Nord-Kivu, Ituri, and Sud-Kivu. Starting in 2018, a significant intensification in reported events occurs, with 1,500+ reported events lasting through 2023. Nord-Kivu alone reported over 13,600 events between 2008 and 2025, and especially 2018.
This escalation coincides with the resurgence of the Allied Democratic Forces (ADF), the re-emergence of the M23 rebel group, and intensifying communal violence in areas like Djugu in Ituri (UN Security Council, 2021; CSIS, 2023). The ADF's pledge of allegiance to the Islamic State in 2019 contributed to a rise in both the scale and brutality of attacks, particularly in Beni and Irumu territories (UN Security Council, 2021). Joint Ugandan-DRC military operations launched in 2021, aimed at rooting out ADF strongholds, further disrupted regional dynamics and provoked retaliatory violence (AP News, 2022).
Although eastern DRC remains the epicenter of unrest, minor upticks in event frequency have been observed in central and western regions, suggesting a potential diffusion of violence or rise in localized disputes (RUSI, 2023). This increase reflects deep-rooted instability compounded by foreign interference, armed group fragmentation, and competition over resource-rich territories.
Fatalities
The total number of fatalities (which are not cumulatively visualized in our map, but can be found when individual event points are engaged via a click) follows a similar pattern as battle and violence against civilians events. The two event types drove the highest number of fatalities. The cumulative total of all fatalities during our analysis period was 57,208, of which 54,165 were a result of violence against civilians and battles - representing 94.68%. The largest number of fatalities occurred during Rebel group - Civilian interactions (25.2%), followed by State focus - Rebel Group interactions (17.8%), Political militia - Civilian interactions (16.6%), and State forces - Political militia (16.2%). All other interaction pairs resulted in lesser fatality quantities, but are still nonetheless significant.
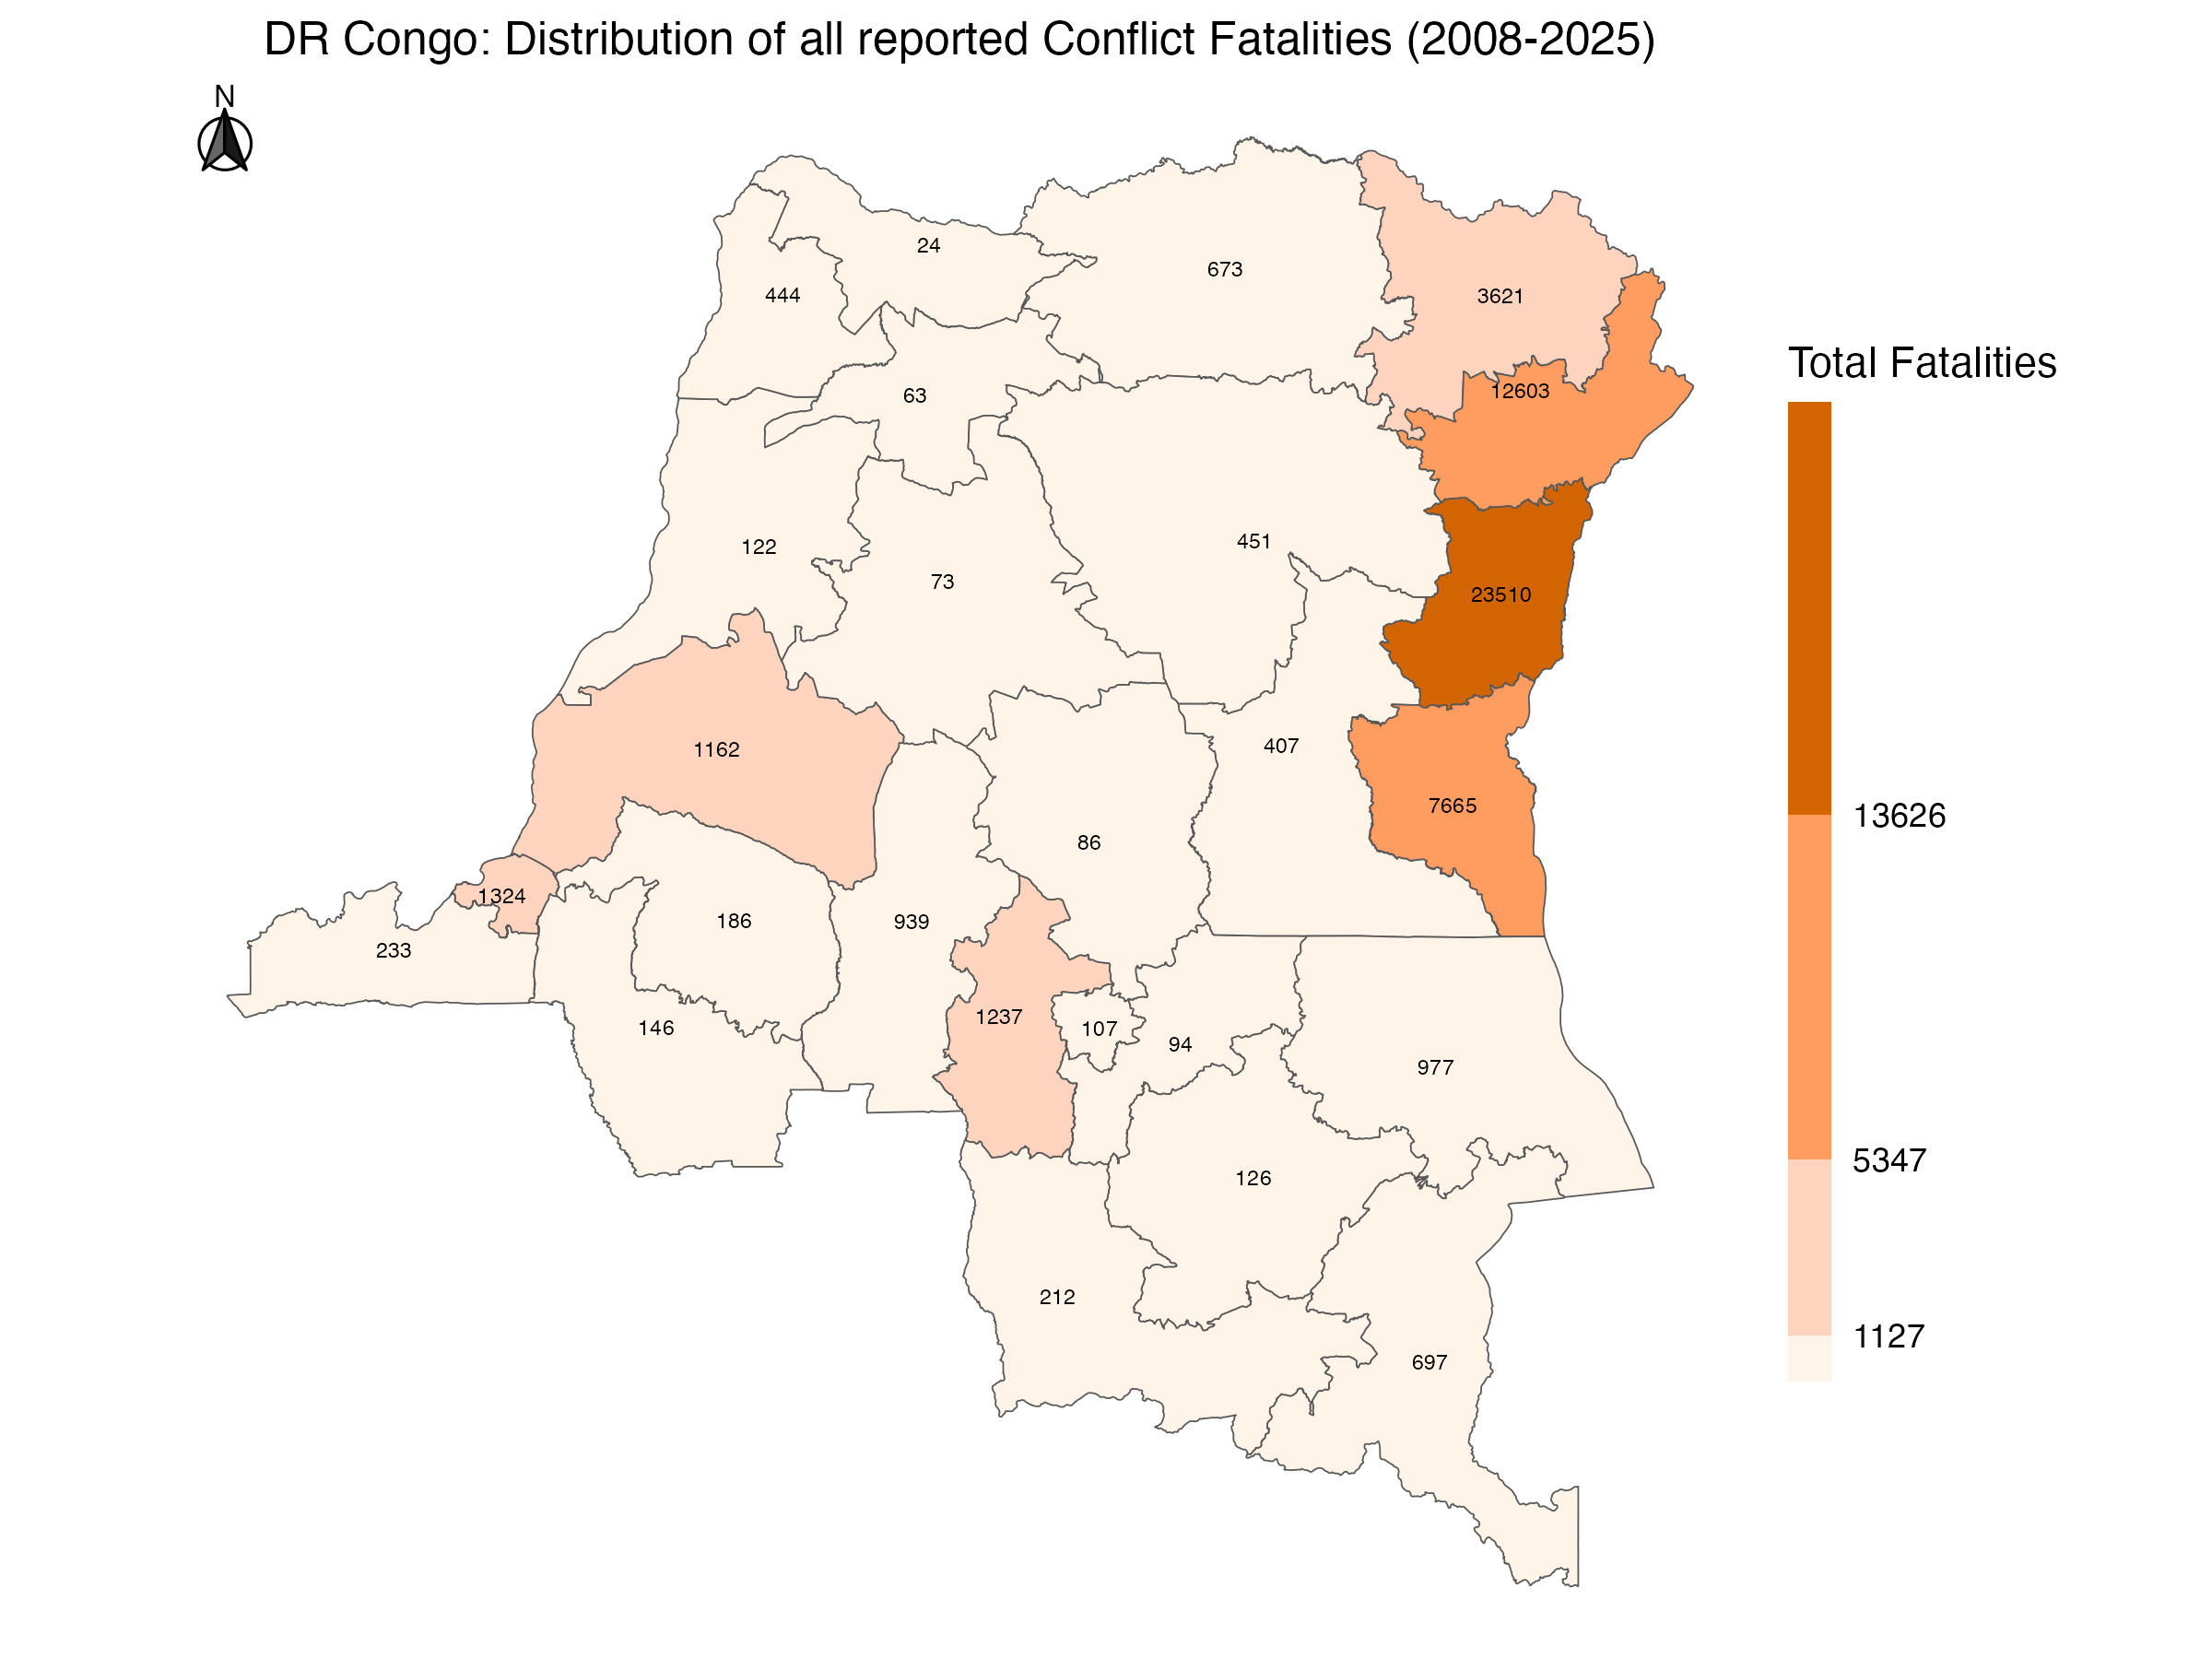
Conflict-related fatalities followed a similar geographic pattern to events. Nord-Kivu stands out with a staggering 23,510 fatalities-nearly double that of Ituri, the second-highest with 12,603 deaths. Sud-Kivu also shows a high toll at 7,665. These three eastern provinces alone account for the vast majority of total fatalities, highlighting the intensity of conflict in this region. In contrast, provinces like Nord-Ubangi, Mongala, and Tshuapa report significantly fewer deaths, each with under 100 fatalities, suggesting relatively lower levels of violence.
Resources
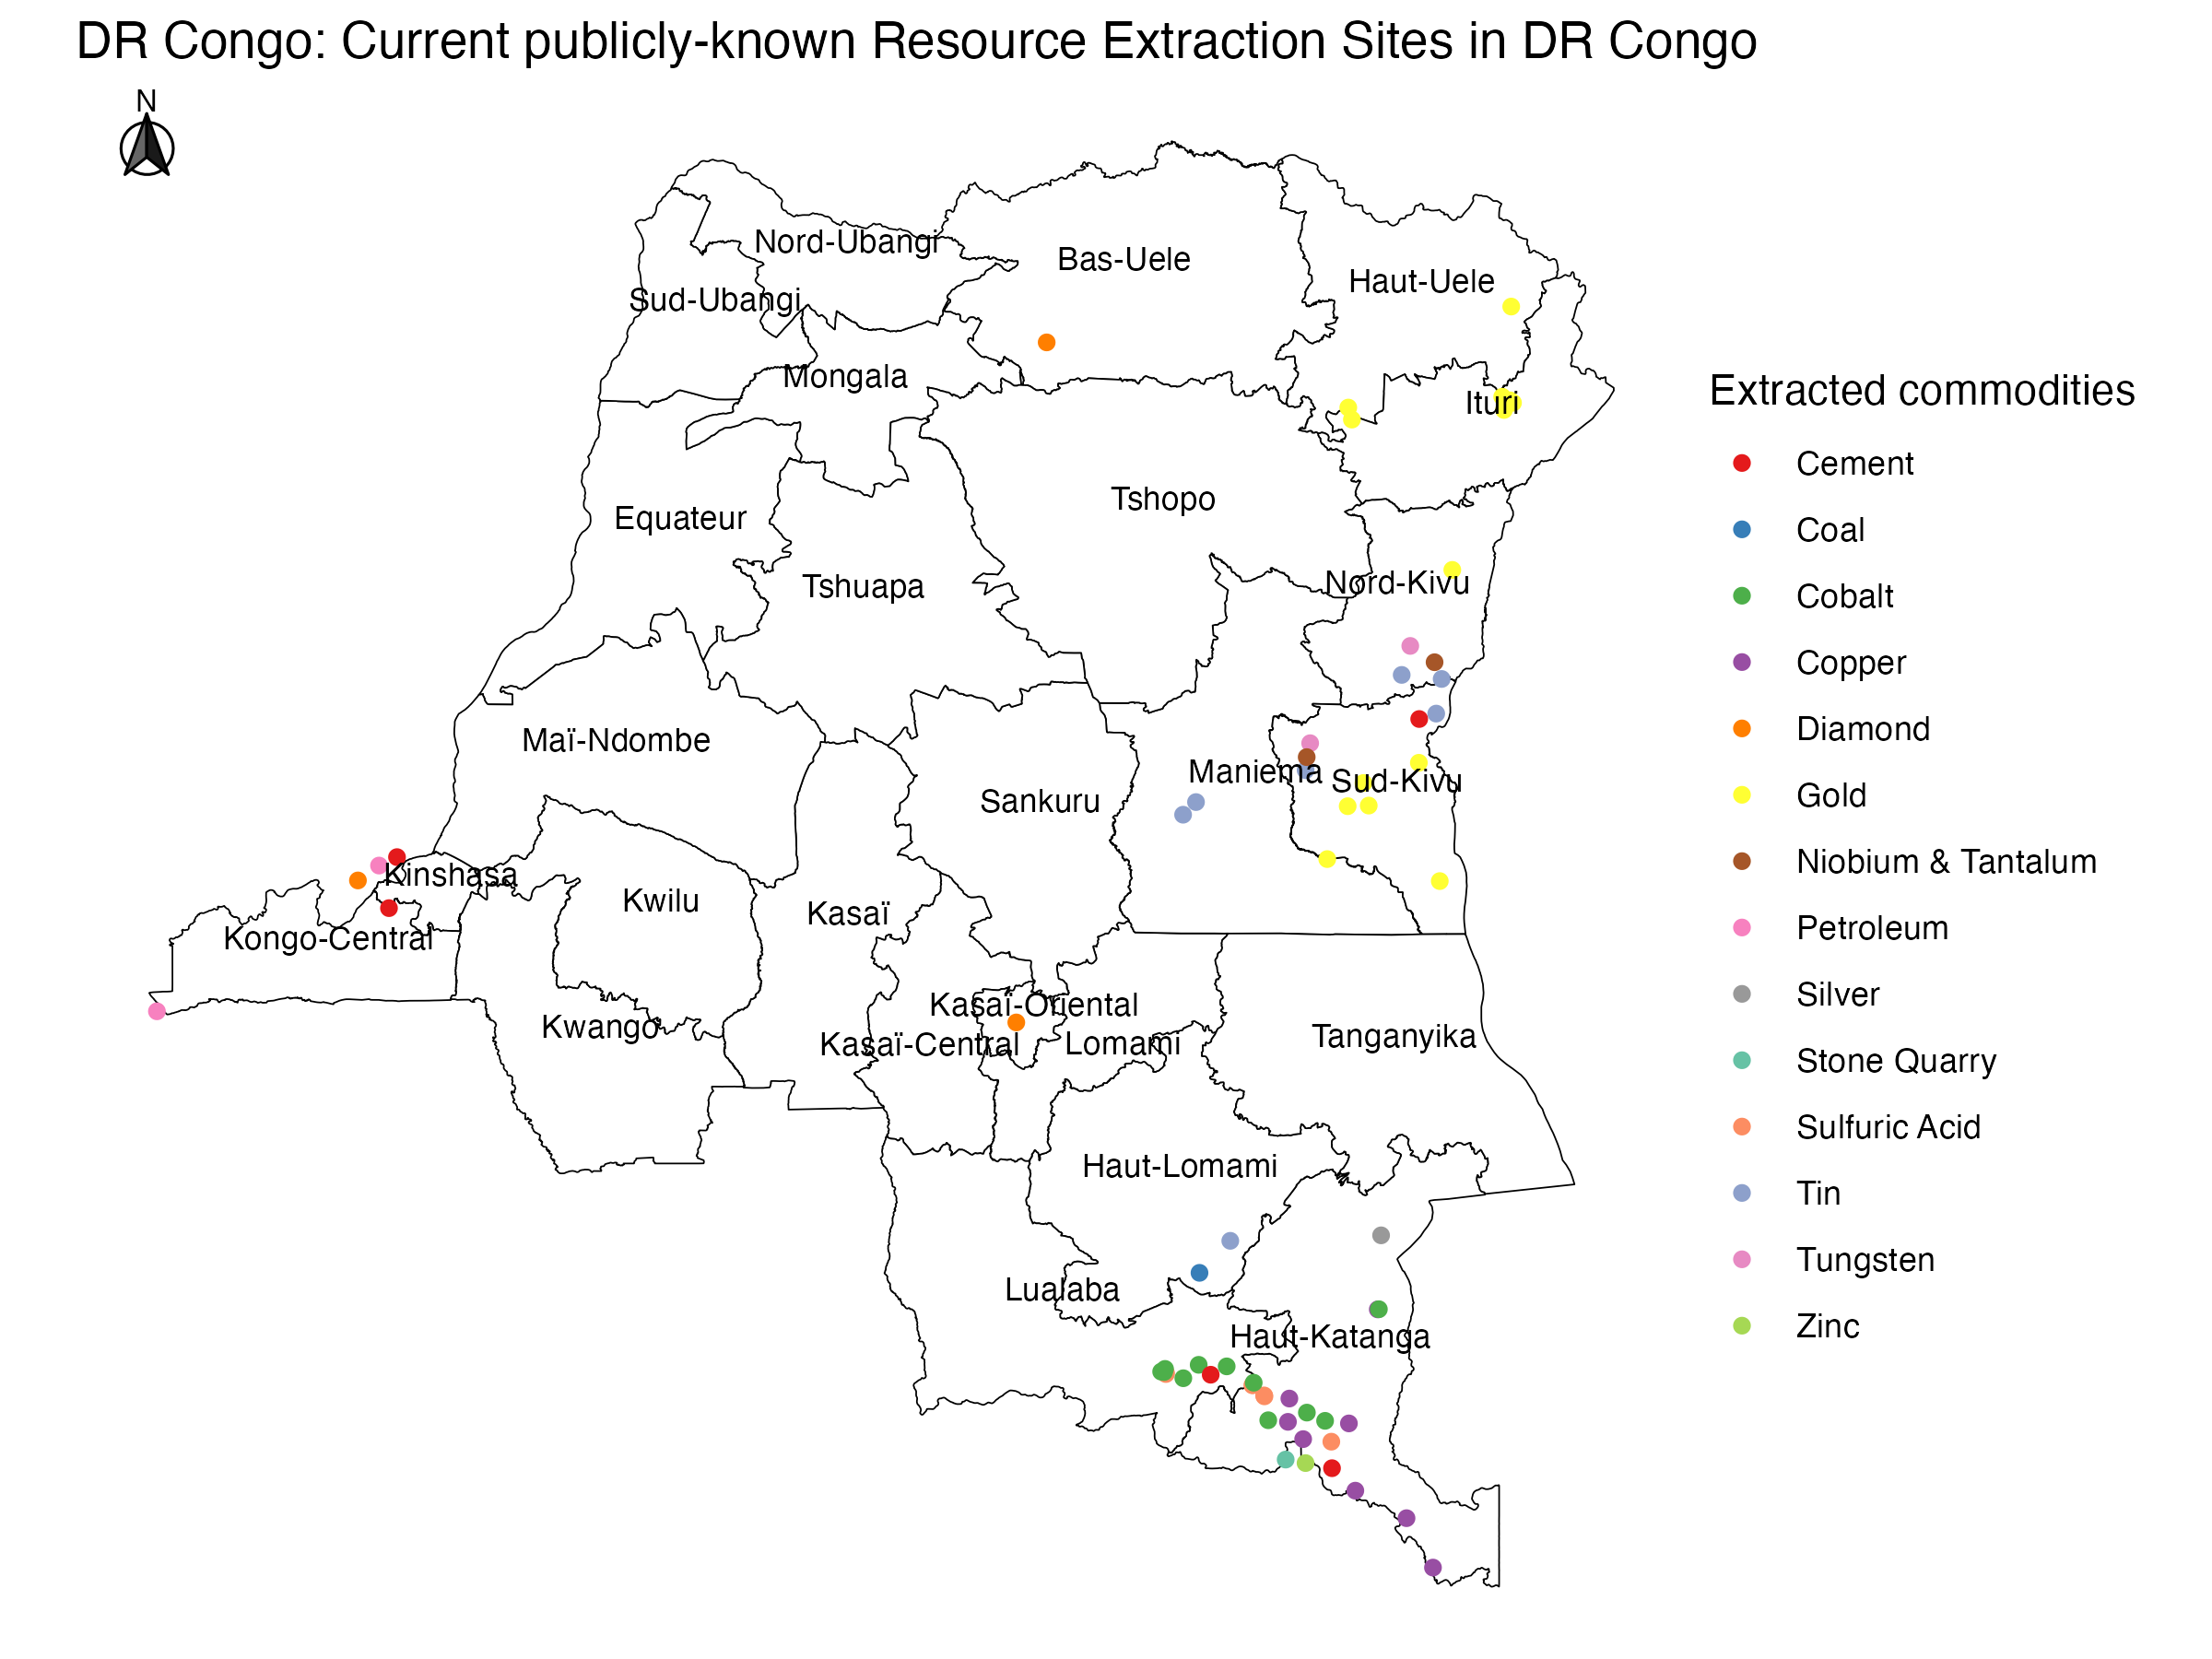
The same provinces with high activity and fatalities-Nord-Kivu, Ituri, and Sud-Kivu-are rich in conflict minerals like gold, coltan, tin, and tungsten (Panzi Foundation, n.d.). These resources are lucrative and poorly regulated, making them a key funding source for armed groups. Militias control mining sites, exploit local labor, and smuggle minerals across borders, fueling cycles of violence. Foreign actors, including companies and smuggling networks, often indirectly fund conflict by purchasing untraceable minerals extracted from these zones (Wexler, 2024).
In sum, the high fatality and event counts in eastern DRC are not just the result of internal instability - they are deeply entangled with external political agendas and extractive economies, especially those linked to global supply chains.
Democracy Index and Military Spending
The Democracy Index is and has been low in this part of Africa. Particularly the DR Congo with its values between 1 and 2.8 has a very low democracy index. For the surrounding countries the Index shows a slight decrease, as in the case of Rwanda (3.8 → 3.3) and Uganda (5 → 4.5), or a strong decrease, in the case of Burundi (4.5 → 2) . For a comparison, the world average for 2024 lies at 5.17. The current state of affairs in the DR Congo is challenged by numerous regional and domestic challenges to its governance and internal stability (Global Institute of Democracy, 2024). Internally, significant irregularities during the last elections in late 2023 (Nantulya, 2024) further undermine the democratic performance. The decrease in Rwanda can be attributed to the increasing autocratic rule of the Kagame regime, which has had a great impact on religious and movement freedom, as well lack of free elections (Global Institute of Democracy, 2024).
Uganda has the highest share of government spending allocated to the military in this region of Africa. Military expenditure peaked in 2011 at 16.7%, with a smaller peak in 2020 at 12%. In contrast, Rwanda consistently shows the lowest military spending, averaging around 4.5%. In the Democratic Republic of the Congo (DRC), military spending has fluctuated significantly over time. It reached a high of 9% in 2013, dropped to a low of 3.25% in 2022, and rose again to 7% in 2023. For Burundi, military spending increased steadily until 2016, peaking at 10%, followed by a decline until 2022, and a renewed rise to 10% in 2023. For context, military spending varies widely across the globe. In 2023, Switzerland allocated 2.2% of its government budget to defense, while Germany allocated 3%. However, some countries with no active involvement in major conflicts still report significantly higher military expenditures, such as Singapore, at 18%, and Armenia, at 20%.
Although conflict events began intensifying in the mid-2010s, this trend is not clearly reflected in the democracy index or military spending data. In the case of the Democratic Republic of Congo, the democracy index was already low, which may explain why the escalation of conflict did not further reduce its score, particularly given that the index is influenced by multiple factors beyond conflict alone. Furthermore, no significant increase in military spending is observed in the DRC in the 2010s. With regard to M23 rebel group activities, which began in 2012 and have peaked again in recent years, there are corresponding increases in the DRC's military spending in both 2012 and 2023. But due to significant fluctuations in military expenditure over time, a direct correlation cannot be confidently established. Interestingly, no recent rise is evident in Rwanda's military spending, despite allegations that it has supported M23 operations.
Additional Resources
Limitations
Only conflicts registered in the DR Congo are displayed on our map. We are aware of the fact that most conflicts are located near the border to Uganda, Rwanda and Burundi and that they may be related to bigger conflicts on an international scale. In another project, it would be interesting to also include conflicts in neighbouring countries of the DR Congo to get a more comprehensive picture of the situation. The same goes for military expenditure and the democracy index which are both displayed only for neighbouring countries of the DR Congo and the DR Congo itself. Another data limitation is, that military expenditure data differs across different databases. We therefore chose to trust the database with the longest timeperiod and most parameters available. Nearby countries may influence each other politically and economically, which is why it would be interesting to map an even greater area in a further project. We have to be aware that not all (types of) conflicts are registered and therefore aren't displayed on the map. We therefore chose to display the types of conflicts that are listed most frequently in the database by ACLED. Also, we chose not to explicitly name the different actors involved in the conflict, since there are simply too many different parties involved. They can, however, be seen when clicking on a conflict location point in the web map. Nevertheless, one should not forget that people are experiencing the consequences of these conflicts. We are no experts regarding the geographic region around the DR Congo and have no all-encompassing knowledge about local or cultural events and habits. Our interpretations of the conflict locations and developments should therefore not be understood as "the one and only" interpretation of events.
Design Decisions
Color Scheme
We selected the color scheme of our website to represent various aspects of the Democratic Republic of Congo's natural identity. Green symbolizes the lush Congolese forests, while earth tones such as brown, tan, and yellow evoke the natural landscape and convey a grounded, serious tone. We added a blue to reflect natural water resources, while aiming for a color-blind friendly color scheme, which we checked for. For readability, we chose an off-white or light gray background and used black text for strong legibility and contrast.
Column Graphs
The Democracy Index scores are visualized in a column graph, as they are discrete values that get assigned to a country once a year. They can be compared across differently sized or populated enumeration units (i.e. countries), as they are standardized values. Since we are used to see temporal evolutions from left to right, we decided to display the data in a column instead of a bar graph.
The Military Spending describes the military expenditure by country in constant (2022) US$ (Millions) and is collected once per calendar year. It therefore is a discrete, scale variable and can be visualized in a column graph. Again, the year is displayed on the x-axis.
Further Reading
The following articles provide further insight into what is currently happening in the Democratic Rpublic of Congo:
Africa Center for Strategic Studies. (2022). Rwanda and the DRC at risk of war as new M23 rebellion emerges: an explainer. Available at: https://africacenter.org/spotlight/rwanda-drc-risk-of-war-new-m23-rebellion-emerges-explainer/
Henzler, E. (n.d.). GoE report -why knowing the facts isn't enough. Available at: https://www.congoresearchgroup.org/en/2022/11/09/goe-report-why-knowing-the-facts-isnt-enough/
Larmer, M., Laudati, A., & Clark, J. F. (2013). Neither war nor peace in the Democratic Republic of Congo (DRC): profiting and coping amid violence and disorder. Review of African Political Economy, 40(135), 1-12.
Literature Sources
Amnesty International (2024). Why is the Democratic Republic of Congo wracked by conflict? Available at: https://www.amnesty.org/en/latest/campaigns/2024/10/why-is-the-democratic-republic-of-congo-wracked-by-conflict, accessed on 12.04.2025.
Bertin, J. (1983). Semiology of graphics. Madison: University of Wisconsin Press. (Original published in 1967, Paris: Mouton)
Center for Preventive Action (2025). Conflict in the Democratic Republic of Congo, Global Conflict Tracker. Available at: https://www.cfr.org/global-conflict-tracker/conflict/violence-democratic-republic-congo, accessed on 12.04.2025.
Center for Strategic and International Studies. (2025). Kenya and the Democratic Republic of the Congo. https://www.csis.org/analysis/kenya-and-democratic-republic-congo
de Deus Pereira, J., & Weeden, A.-M. (2025, May 7). Congo's fragile truce? Foreign interference and conflict minerals in the DRC. Royal United Services Institute. https://www.rusi.org/explore-our-research/publications/commentary/congos-fragile-truce-foreign-interference-and-conflict-minerals-drc
Huon, P. (2025). After the fall of Goma and Bukavu, where is DR Congo's M23 war headed?, The New Humanitarian. Available at: https://www.thenewhumanitarian.org/analysis/2025/03/20/after-fall-goma-and-bukavu-where-dr-congos-m23-war-headed, accessed on 12.04.2025.
Knickmeyer, E., & Banchereau, M. (2025, April 25). The US oversees a peace pledge for east Congo, hoping to ease its access to critical minerals. AP News. https://apnews.com/article/rubio-congo-rwanda-conflict-minerals-trump-11f6dd0a8612734fc8e074da81e9d8cf
Panzi Foundation. (n.d.). Conflict minerals and sexual violence in the DRC. https://panzifoundation.org/conflict-minerals-and-sexual-violence-in-the-drc/
Slocum T. A., McMaster, R. B., Kessler, F. C., & Howard, H. H. (2009). Thematic Cartography and Geographic Visualization (3rd edition). Upper Saddle River, NJ: Pearson/Prentice Hall.
United Nations (2015). The 17 Goals, United nations sustainable development goals. Available at: https://sdgs.un.org/goals, accessed on 12.04.2025.
United Nations (n.d.). Goal16. Available at: https://sdgs.un.org/goals/goal16, accessed on 12.04.2025.
United Nations Security Council. (2021). Letter dated 20 December 2021 from the Group of Experts on the Democratic Republic of the Congo addressed to the President of the Security Council (S/2021/987). https://www.securitycouncilreport.org/atf/cf/%7B65BFCF9B-6D27-4E9C-8CD3-CF6E4FF96FF9%7D/S_2021_987_E.pdf
White, T. (2017). Symbolization and the Visual Variables. The Geographic Information Science & Technology Body of Knowledge (2nd Quarter 2017 Edition), John P. Wilson (ed.). DOI: 10.22224/gistbok/2017.2.3.
Wexler, A. (2024, October 16). How this conflict mineral gets smuggled into everyday tech. The Wall Street Journal. https://www.wsj.com/business/how-this-conflict-mineral-gets-smuggled-into-everyday-tech-5a4b197f