Energymix of Europe

GEO 454 Project of Group 7

Explore the Map

Map

Background

Context

This web map aims to answer the question, where and what kind of energy is used and traded in Europe. It is the product of a student project at the Department of Geography at the University of Zurich. The assignment was to create an interactive web map in any relation to one or multiple UN Development Goals (see more below).

UN Goal

UN Sustainable Development Goal 7 is named “Affordable and Clean Energy” and aims to “ensure access to affordable, reliable, sustainable and modern energy for all” . Energy trade is necessairy since most countries cannot produce enough electricity for their own demand and most energy is produced in ways which are not contributing to achieving the set goals (“clean”, “sustainable” energy). To monitor the state of the goal an overview about energy trade and the mix of production can be useful.
...

Limitations

Here the limitations of the project are explained:

  • To ensure that the scope of the project does correspond to the available time and resources we limit the project to Europe. This limitation further ensures that the data is reliable and mostly complete for the entire area examined.
  • Due to the lack of data provided by the countries, there are some differences between the energy trade map and the energy mix map, since they both rely on the publication of data by the countries themselves.
  • Due to some countries outer shape, or oversea territories, it is possible that their centroid point, which is used to fix the network points in the energy trade map, lie outside of their territory. This is the case for France and Croatia for example. However, since the trading network only is visible when a specific country is selected, we chose not to work out a fancy solution for this minor issue.
Methods

First, the data for the energy mix and energy trade were collected and processed into Excel spreadsheets from the source. Then, the data was imported into ArcGIS and visualized as maps. These maps with pop-ups were then integrated into this website and complemented with additional texts. More information on the process of our project can be found in the project pitches linked in the About section.

Data

The data for this project was gathered from Observatory of Economic Complexity (OEC) in two seperate spreadsheets for Energy Mix data and Energy Trade data. The trade data was manually implemented into an import-export matrix. Then, the trading data was further separated into an import and an export dataset for easier handeling of the data in the next steps.

The base layer of the Energy Trade map depicts the "Energy Index". We created this measurement ourselfs with the following equation:

$$\text{Balance Score} = \frac{\text{Exports} - \text{Imports}}{\text{Exports} + \text{Imports}}$$

This creates a score between -1 and 1 indicating if a country imports more energy than it exports. We assume that exporting more energy than importing can be seen as a good thing, since it means the energy is produced locally. But of course this can be challenged, since local production does not always mean clean production, especially in the field of energy production. This is illustrated by the example of Russia, whose energy production mostly relies on "dirty" oil and coal or nuclear powerplants. However, we argue that the information if a country is more dependant on energy import still is a valuebale information to gain a deeper insight into our data.

Map Design

This section explains how we created our maps and how we decided on the visualization choises. Questions of symbolization, like the trade networks and country visualisations were decided on the basis of Jaques Bertins "Semiology of Graphics: Diagrams, Networks, Maps", emphasizing higher values with darker hues or bigger sizes and depicting smaller values with lighter hues or smaller sizes.

  • A dark basemap helps shifting the focus of the user onto the shown data while at the same time allowing an easy way of orientation if needed.
  • The network lines in the Energy Trade map provide two independent ways of providing information: The colour and the size of the lines correspond to the trade value of each import/export relation of the chosen country. This way, people who have difficulties estimating colours or size can rely on the other visualization.

Website

The website was built with a template from www.startbootstrap.com and modified with Brackets in HTML5.

The website navigation is deliberately designed to be redundant so that it can be navigated either using the tabs at the top or by simply scrolling. There is also a prominent button directly on the homepage that leads directly to the maps. These are also the first section after the home page, so they can be opened as easily and quickly as possible. This is followed by further information, such as the background of the project, the methods and data bases and more.

Interactive links help you get to the sources and further information quickly and easily. The links are highlighted in a common format.

While it was initially planned to include device independency (meaning you can also use our website on a smartphone or tablet), we were not able to optimize the implemented map for other displays.

Findings

This section tries to answer our research questions ("where and what kind of energy is used and traded in Europe"). We want to remind you about the limitations of this project, which are explained in the Background section.

Energy Mix

The energy mix map shows, that there are big differences between the countries regarding the share of renewable energy. Norway and Great Britain have the biggest share of renewables in their electricity mix. Germany, Sweden and Lithuania, but also Montenegro, Albania and Romania, have high shares in clean energy production. On the other hand, Greece, Bulgaria, Austria and Hungary but also the Netherlands have a rather low share of renewable energy in their consumption mix.

Energy Trade

Our maps show the different relations between the countries in Europe in energy trading. At the top of the importing countries are big industry nations like France, Germany and Italy. Not far behind follow Switzerland, Hungary and Austria. The biggest exporters on the other hand are surprisingly very similar countries, Germany and France lead by far, while Italy has very low exports compared with the other two.

But even more interesting than the simple import and export data is the relation between them, depicted in our Energy Index. Reminder: negative values indicate higher import rates than export rates, while positive values indicate the opposite. Values near zero indicate that a countries energy balance between imports and exports equals 0, meaning there is either no energy traded at all or just as much energy is exported as it is imported. This leads to the following results:

Importers (in order from big to small): Andorra, San Marino, Malta, Luxembourg, Italy, Moldova, Lithuania, Portugal, Serbia, Montenegro, Finland, Hungary, Romania, Greece, and Latvia.

Neutrals (Index near or is 0): France, Germany, Switzerland, Austria, the Netherlands, UK, Denmark, Slovenia, Croatia, Slovakia, Estonia, Ukraine, Macedonia and Albania.

Exporters (in order from big to small): Belarus, Russia, Bulgaria, Sweden, Spain, Norway, Ireland, Poland, Belgium, Czechia, and Bosnia.

Please remember that this Index only refers to internal trade in said countries. It shows the share of imports in relation to the exports of the same country and thus comparison between different countries must be made considering the nature of the data and the index!

Sources

Observatory of Economic Complexity (OEC) is an online data visualization and distribution platform focused on the geography and dynamics of economic activities. It was founded as a Masters-Thesis at the Massachusetts Institute of Technology (MIT).

...

About

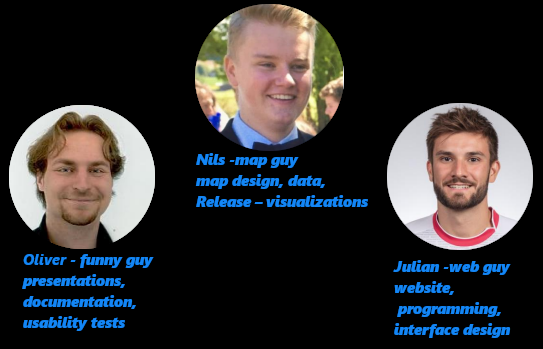
Our team consists of Nils, responsible for data, maping and visualizations, Julian, responsible for website, design and programming and Oliver, responsible for documentation, presentation and text writing.

...


Here you find the project pitches that we presented during the process to introduce the concept and progress of the project:

Concept Proposal Progress Review

Contact

Address


Winterthurerstrasse 190, 8053 Zurich

Phone


+41 58 648 48 48