
• HOME
  • GEO878 - Geovisualization, Departement of Geography, University Zurich

  • Lab 1 Lab 2 Lab 3
  • Project
  • Authors
  • links/source
  • Project description

    The general idea of the project was to create a research topic with the background of one of the 17 UN sustainable development goals. We chose the 12th sustainable development goal for our project. This goal promotes sustainable consumption and production patterns. One of the targets is to "support developing countries to strengthen their scientific and technological capacity to move towards more sustainable patterns of consumption and production". (Sustainable Development Goals 2016) However, consumption and production patterns are highly complex and include many aspects such as resource and energy use, infrastructure, job opportunities and life quality and they are not bound to more or less developed countries. Moreover, one part of sustainable production is to have low CO2 emissions, including CO2 discharge from agricultural production. In the end ensuring sustainable consumption and production helps in achieving overall development plans, reducing poverty and strengthening economic competitiveness. (UN Sustainable Development Goals 2016)

    But if sustainable consumption and production has an impact on the development of a country, does it mean that the development stage correlates with the amount of agricultural CO2 emissions? Does the agricultural production in higher developed countries release less CO2 than in less developed regions?

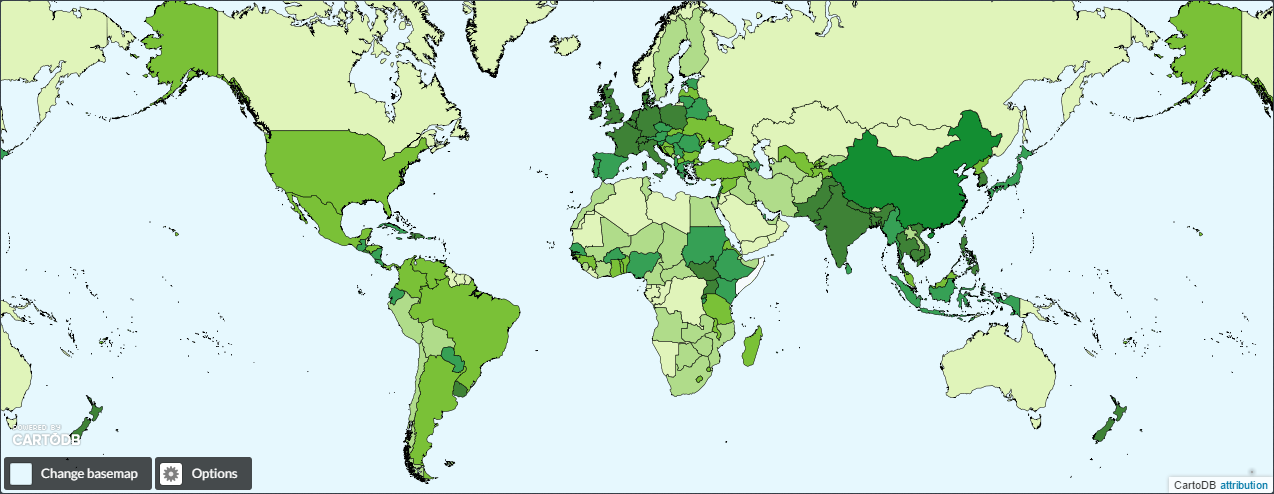
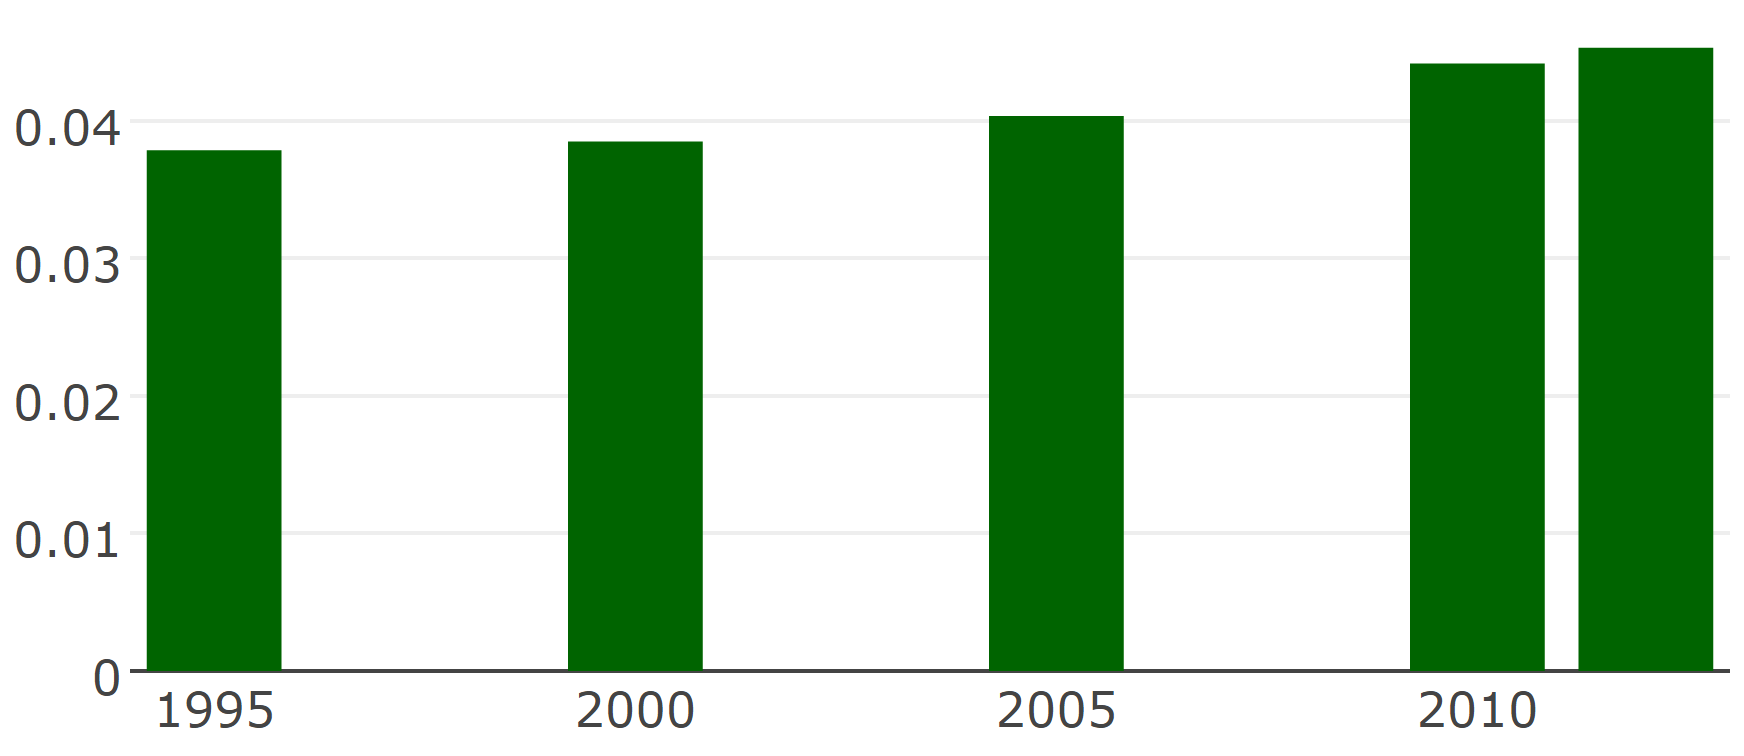
    With this project we are trying to answer that question by looking at the development stage of countries all over the world and comparing them with their agricultural CO2 emission level. To find a correlation between the development stage and the CO2 emissions the software environment for statistical computation and graphics R was used. To also be able to detect a temporal pattern visually we created a timeline, using CO2 data from five different years: 1995, 2000, 2005, 2010 and 2012, based on JavaScript. The data set of 2012 contains the most up-to-date data.

    By clicking through the visualizations below you will be guided through the different analytical steps which were conducted in order to answer the research question.

  • Research question

    Does a high development status of a country have a positive (increasing) impact on the amount of agricultural CO2 emissions?

  • Data information

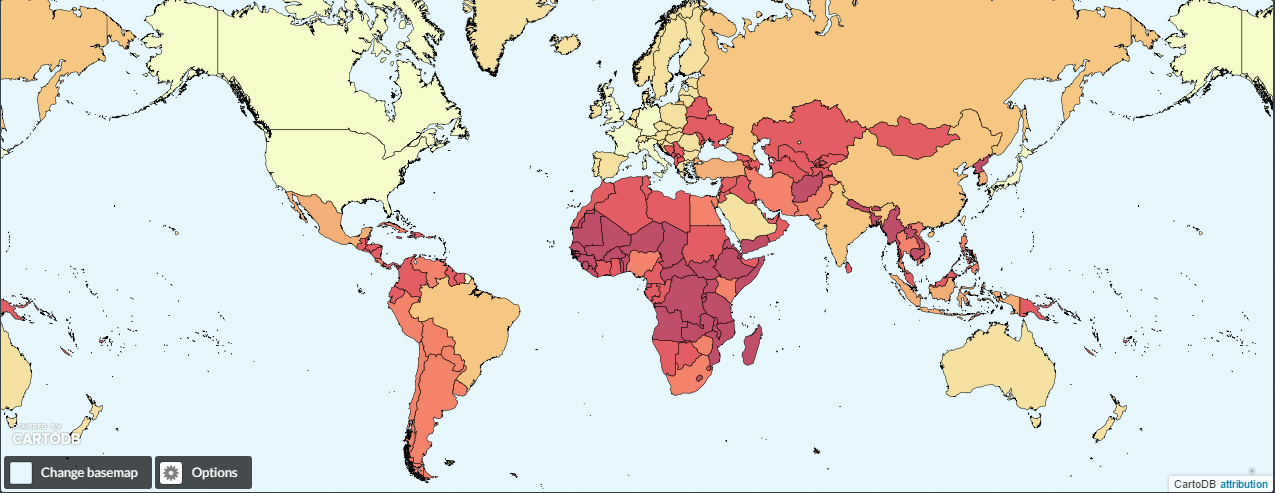
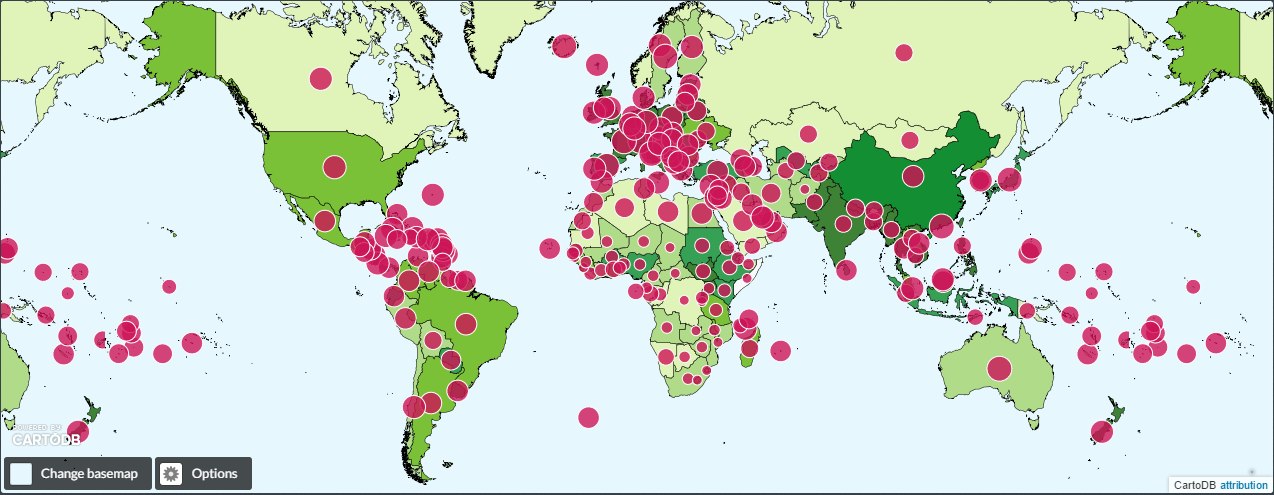
    This map depicts the development stages of all the 247 countries in the world. The countries are split into seven development stages, ranging from developed region to least developed region including the G7, NON G7, BRIC, MIKT and G20 countries. The developed countries are split into the \"The Group of Seven\" (G7) and non-G7 countries. The G7 countries consist of seven industrialized democracies, namely the United States, Canada, France, Germany, Italy, the United Kingdom and Japan. (Council on Foreign Relations 2015)

    The emerging regions are also divided into subgroups, namely the BRIC, the MIKT and the G20 countries. The BRIC states consist of the four countries Brazil, Russia, India and China. The MIKT are sometimes also called MIST countries and consist of the four states Mexico, Indonesia, (South) Korea and Turkey. The G20 countries usually include Argentina, Australia, Brazil, Canada, China, France, Germany, India, Indonesia, Italy, Japan, Republic of Korea, Mexico, Russia, Saudi Arabia, South Africa, Turkey, United Kingdom, United States, European Union. However, this is not quiet the case in this dataset. India, China, Brazil and Russia were already assigned to the BRIC countries in this data set. And Mexico, Indonesia, the Republic of Korea and Turkey are in the group of MIKT states. On the other hand, countries which are usually not counted to the G20 countries were added. These states are Peru, Bolivia, Chile, Paraguay, Uruguay, Nigeria, Egypt, Iran, Pakistan, Thailand, Vietnam, Venezuela and Cuba. An explanation for this change of states could not be found. Thus, even though the source was given by the course instructors and claimed to be reliable the data should be viewed critically.

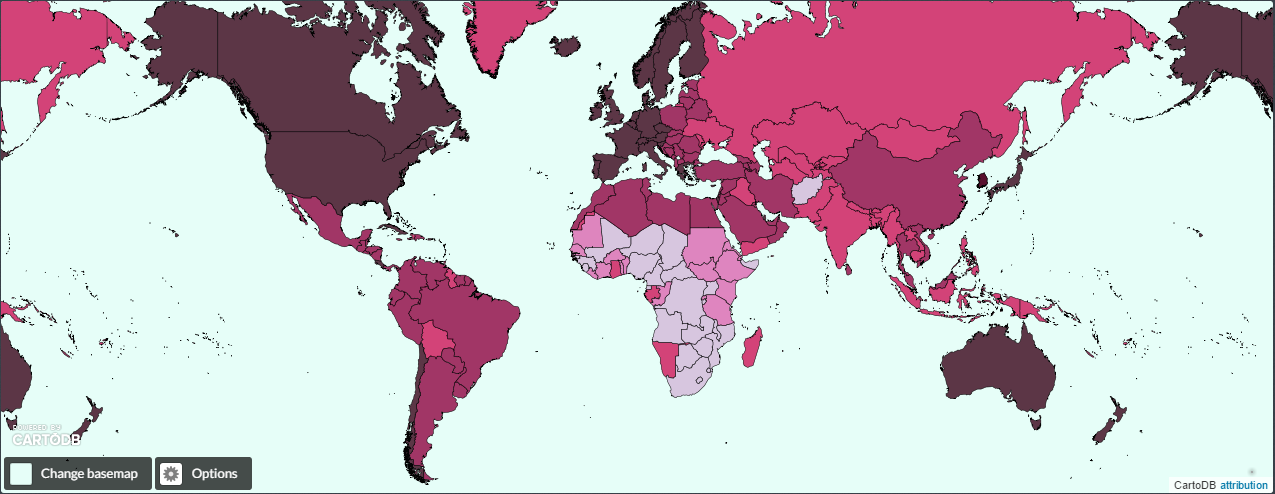
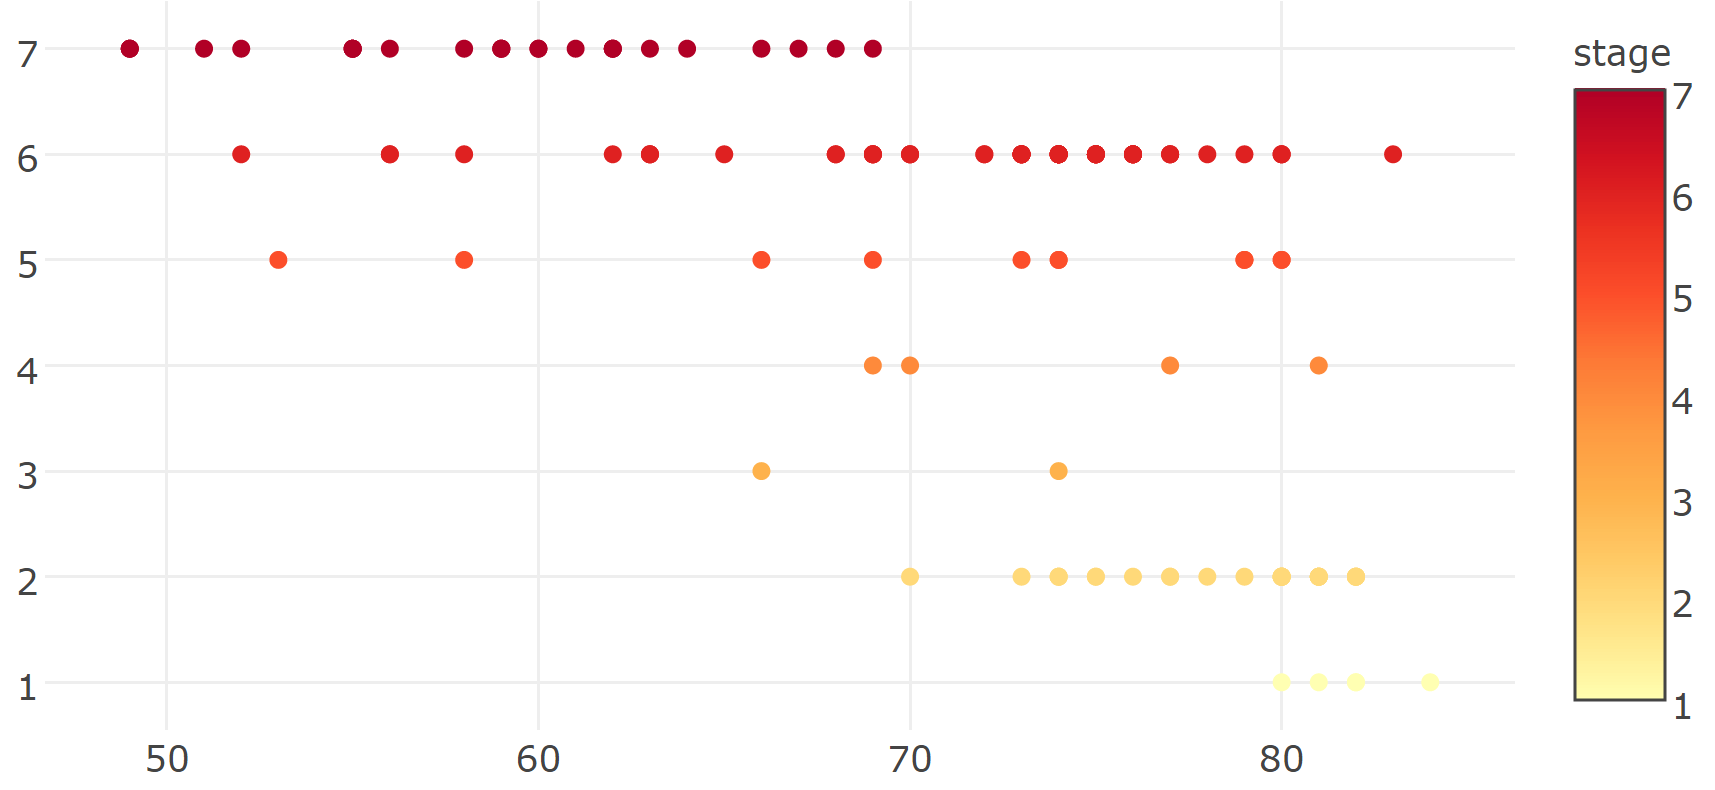
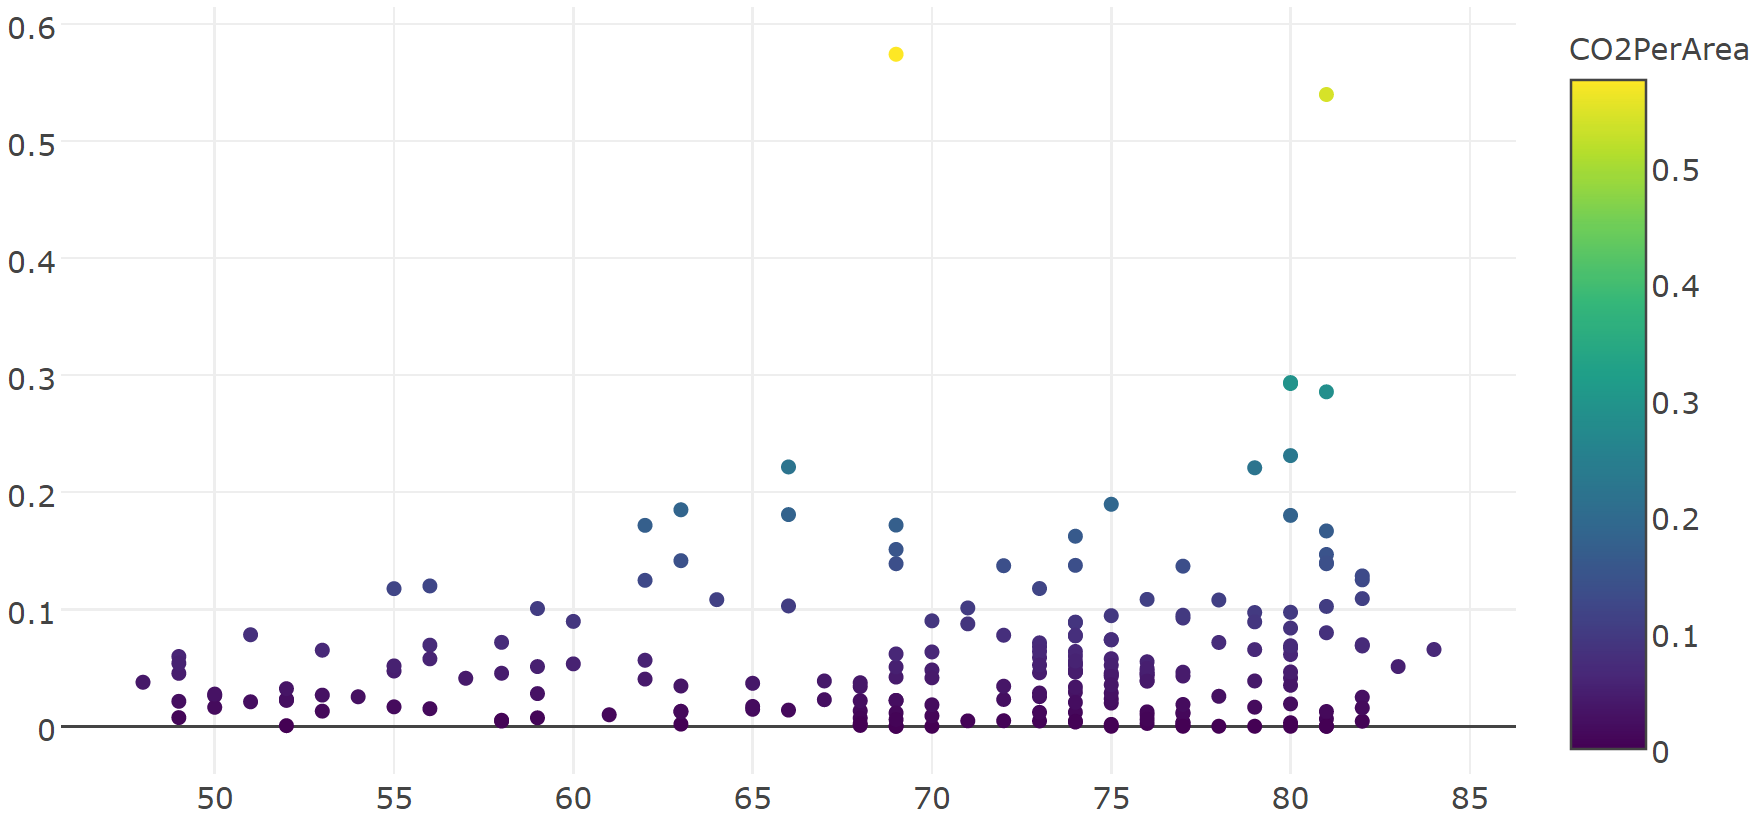
    In order to increase the quality of the project evaluation life expectancy data was included as a second criterion to judge the development stage of a country. To do so, the correlation coefficient between the two data sets was computed. With a correlation coefficient of -0.62 we have a negative correlation between life expectancy and development stage. This means that the higher the life expectancy in a country is, the higher is its development stage. Even though the correlation coefficient between the two data sets is not high we can thus use the life expectancy data to validate the dependency between amount of CO2 emissions and country development status.

    The remaining countries belong to the developing and least developed regions. When looking at the map it gets obvious that those countries are mainly located in middle America and on the African continent. So in general there is a gap between the global North and the global South. The countries in the global North generally show a high development stage while the states in the global South mainly have a low development stage. For white areas no data was available.

    Data reference

    Source: World economic & population (Nature World)

    Data set: Admin0 Countries

    Version: 3.1.0

    Access: 5.25.2016

  • Development stage

  • Life expectancy

  • Correlation of development

    stage and life expectancy

  • CO2 emission timeline

  • Agricultural emissions

  • Correlation of life

    expectancy and CO2

  • Final Map

Go to...

> Lab 1
> Lab 2
> Lab 3
> Project
> Authors
> Links/Sources

Impressum

Contact us for more information

markus.baumann@uzh.ch
tiziana.speckert@uzh.ch
jaqueline.boog@uzh.ch

Copyright

© 2016